

General household survey - Statistics South Africa
General household survey - Statistics South Africa
General household survey - Statistics South Africa

You also want an ePaper? Increase the reach of your titles
YUMPU automatically turns print PDFs into web optimized ePapers that Google loves.
<strong>Statistics</strong> <strong>South</strong> <strong>Africa</strong> 109<br />
P0318<br />
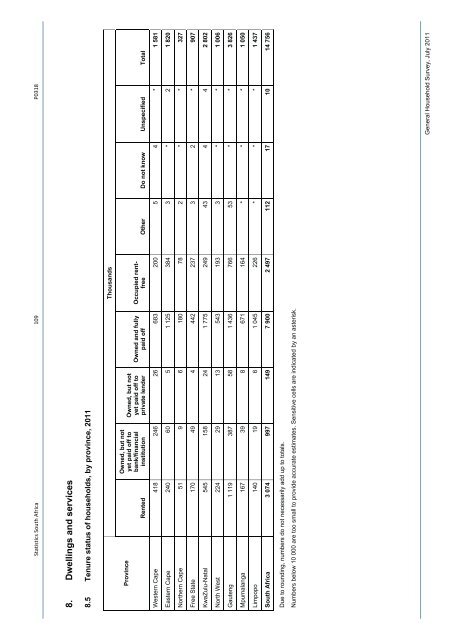
8. Dwellings and services<br />
8.5 Tenure status of <strong>household</strong>s, by province, 2011<br />
Thousands<br />
Province<br />
Occupied rentfree<br />
Other Do not know Unspecified Total<br />
Owned and fully<br />
paid off<br />
Owned, but not<br />
yet paid off to<br />
private lender<br />
Owned, but not<br />
yet paid off to<br />
bank/financial<br />
institution<br />
Rented<br />
Western Cape 418 246 26 683 200 5 4 * 1 581<br />
Eastern Cape 240 60 5 1 125 384 3 * 2 1 820<br />
Northern Cape 51 9 6 180 78 2 * * 327<br />
Free State 170 49 4 442 237 3 2 * 907<br />
KwaZulu-Natal 545 158 24 1 775 249 43 4 4 2 802<br />
North West 224 29 13 543 193 3 * * 1 006<br />
Gauteng 1 119 387 58 1 436 766 53 * * 3 826<br />
Mpumalanga 167 39 8 671 164 * * * 1 050<br />
Limpopo 140 19 6 1 045 226 * * * 1 437<br />
<strong>South</strong> <strong>Africa</strong> 3 074 997 149 7 900 2 497 112 17 10 14 756<br />
Due to rounding, numbers do not necessarily add up to totals.<br />
Numbers below 10 000 are too small to provide accurate estimates. Sensitive cells are indicated by an asterisk.<br />
<strong>General</strong> Household Survey, July 2011


