

General household survey - Statistics South Africa
General household survey - Statistics South Africa
General household survey - Statistics South Africa

You also want an ePaper? Increase the reach of your titles
YUMPU automatically turns print PDFs into web optimized ePapers that Google loves.
<strong>Statistics</strong> <strong>South</strong> <strong>Africa</strong> 28<br />
P0318<br />
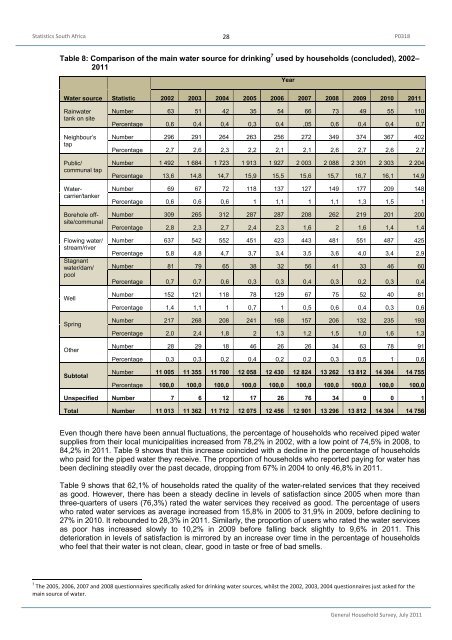
Table 8: Comparison of the main water source for drinking 7 used by <strong>household</strong>s (concluded), 2002–<br />
2011<br />
Water source Statistic<br />
Rainwater<br />
tank on site<br />
Neighbour’s<br />
tap<br />
Public/<br />
communal tap<br />
Watercarrier/tanker<br />
Borehole offsite/communal<br />
Flowing water/<br />
stream/river<br />
Stagnant<br />
water/dam/<br />
pool<br />
Well<br />
Spring<br />
Other<br />
Subtotal<br />
Year<br />
2002 2003 2004 2005 2006 2007 2008 2009 2010 2011<br />
Number 63 51 42 35 54 66 73 49 55 110<br />
Percentage 0,6 0,4 0,4 0,3 0,4 ,05 0,6 0,4 0,4 0,7<br />
Number 296 291 264 263 256 272 349 374 367 402<br />
Percentage 2,7 2,6 2,3 2,2 2,1 2,1 2,6 2,7 2,6 2,7<br />
Number 1 492 1 684 1 723 1 913 1 927 2 003 2 088 2 301 2 303 2 204<br />
Percentage 13,6 14,8 14,7 15,9 15,5 15,6 15,7 16,7 16,1 14,9<br />
Number 69 67 72 118 137 127 149 177 209 148<br />
Percentage 0,6 0,6 0,6 1 1,1 1 1,1 1,3 1,5 1<br />
Number 309 265 312 287 287 208 262 219 201 200<br />
Percentage 2,8 2,3 2,7 2,4 2,3 1,6 2 1,6 1,4 1,4<br />
Number 637 542 552 451 423 443 481 551 487 425<br />
Percentage 5,8 4,8 4,7 3,7 3,4 3,5 3,6 4,0 3,4 2,9<br />
Number 81 79 65 38 32 56 41 33 46 60<br />
Percentage 0,7 0,7 0,6 0,3 0,3 0,4 0,3 0,2 0,3 0,4<br />
Number 152 121 118 78 129 67 75 52 40 81<br />
Percentage 1,4 1,1 1 0,7 1 0,5 0,6 0,4 0,3 0,6<br />
Number 217 268 208 241 168 157 206 132 235 193<br />
Percentage 2,0 2,4 1,8 2 1,3 1,2 1,5 1,0 1,6 1,3<br />
Number 28 29 18 46 26 26 34 63 78 91<br />
Percentage 0,3 0,3 0,2 0,4 0,2 0,2 0,3 0,5 1 0,6<br />
Number 11 005 11 355 11 700 12 058 12 430 12 824 13 262 13 812 14 304 14 755<br />
Percentage 100,0 100,0 100,0 100,0 100,0 100,0 100,0 100,0 100,0 100,0<br />
Unspecified Number 7 6 12 17 26 76 34 0 0 1<br />
Total Number 11 013 11 362 11 712 12 075 12 456 12 901 13 296 13 812 14 304 14 756<br />
Even though there have been annual fluctuations, the percentage of <strong>household</strong>s who received piped water<br />
supplies from their local municipalities increased from 78,2% in 2002, with a low point of 74,5% in 2008, to<br />
84,2% in 2011. Table 9 shows that this increase coincided with a decline in the percentage of <strong>household</strong>s<br />
who paid for the piped water they receive. The proportion of <strong>household</strong>s who reported paying for water has<br />
been declining steadily over the past decade, dropping from 67% in 2004 to only 46,8% in 2011.<br />
Table 9 shows that 62,1% of <strong>household</strong>s rated the quality of the water-related services that they received<br />
as good. However, there has been a steady decline in levels of satisfaction since 2005 when more than<br />
three-quarters of users (76,3%) rated the water services they received as good. The percentage of users<br />
who rated water services as average increased from 15,8% in 2005 to 31,9% in 2009, before declining to<br />
27% in 2010. It rebounded to 28,3% in 2011. Similarly, the proportion of users who rated the water services<br />
as poor has increased slowly to 10,2% in 2009 before falling back slightly to 9,6% in 2011. This<br />
deterioration in levels of satisfaction is mirrored by an increase over time in the percentage of <strong>household</strong>s<br />
who feel that their water is not clean, clear, good in taste or free of bad smells.<br />
7<br />
The 2005, 2006, 2007 and 2008 questionnaires specifically asked for drinking water sources, whilst the 2002, 2003, 2004 questionnaires just asked for the<br />
main source of water.<br />
<strong>General</strong> Household Survey, July 2011


