

General household survey - Statistics South Africa
General household survey - Statistics South Africa
General household survey - Statistics South Africa

You also want an ePaper? Increase the reach of your titles
YUMPU automatically turns print PDFs into web optimized ePapers that Google loves.
<strong>Statistics</strong> <strong>South</strong> <strong>Africa</strong> 131<br />
P0318<br />
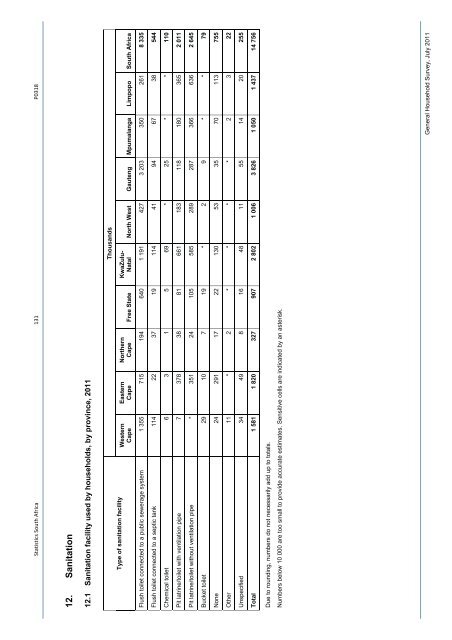
12. Sanitation<br />
12.1 Sanitation facility used by <strong>household</strong>s, by province, 2011<br />
Thousands<br />
KwaZulu-<br />
Natal North West Gauteng Mpumalanga Limpopo <strong>South</strong> <strong>Africa</strong><br />
Northern<br />
Cape Free State<br />
Eastern<br />
Cape<br />
Western<br />
Cape<br />
Type of sanitation facility<br />
Flush toilet connected to a public sewerage system 1 355 715 194 640 1 191 427 3 203 350 261 8 335<br />
Flush toilet connected to a septic tank 114 22 37 19 114 41 94 67 38 544<br />
Chemical toilet 6 3 1 5 69 * 25 * * 110<br />
Pit latrine/toilet with ventilation pipe 7 378 38 81 661 183 118 180 365 2 011<br />
Pit latrine/toilet without ventilation pipe * 351 24 105 585 289 287 366 636 2 645<br />
Bucket toilet 29 10 7 19 * 2 9 * * 79<br />
None 24 291 17 22 130 53 35 70 113 755<br />
Other 11 * 2 * * * * 2 3 22<br />
Unspecified 34 49 8 16 48 11 55 14 20 255<br />
Total 1 581 1 820 327 907 2 802 1 006 3 826 1 050 1 437 14 756<br />
Due to rounding, numbers do not necessarily add up to totals.<br />
Numbers below 10 000 are too small to provide accurate estimates. Sensitive cells are indicated by an asterisk.<br />
<strong>General</strong> Household Survey, July 2011


