

General household survey - Statistics South Africa
General household survey - Statistics South Africa
General household survey - Statistics South Africa

You also want an ePaper? Increase the reach of your titles
YUMPU automatically turns print PDFs into web optimized ePapers that Google loves.
<strong>Statistics</strong> <strong>South</strong> <strong>Africa</strong> 56<br />
P0318<br />
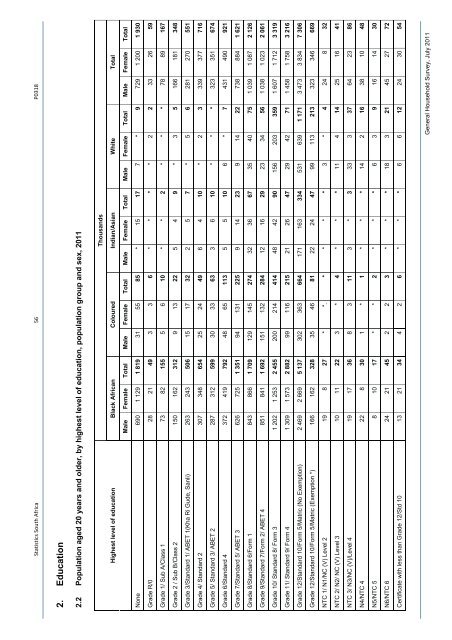
2. Education<br />
2.2 Population aged 20 years and older, by highest level of education, population group and sex, 2011<br />
Thousands<br />
Black <strong>Africa</strong>n Coloured Indian/Asian White Total<br />
Highest level of education<br />
Male Female Total Male Female Total Male Female Total Male Female Total Male Female Total<br />
None 690 1 129 1 819 31 55 85 * 15 17 7 * 9 729 1 200 1 930<br />
Grade R/0 28 21 49 3 3 6 * * * * 2 2 33 26 59<br />
Grade 1/ Sub A/Class 1 73 82 155 5 6 10 * * 2 * * * 78 89 167<br />
Grade 2 / Sub B/Class 2 150 162 312 9 13 22 5 4 9 * 3 5 166 181 348<br />
Grade 3/Standard 1/ ABET 1(Kha Ri Gude, Sanli) 263 243 506 15 17 32 2 5 7 * 5 6 281 270 551<br />
Grade 4/ Standard 2 307 348 654 25 24 49 6 4 10 * 2 3 339 377 716<br />
Grade 5/ Standard 3/ ABET 2 287 312 599 30 33 63 3 6 10 * * * 323 351 674<br />
Grade 6/Standard 4 372 419 792 48 65 113 5 5 10 6 * 7 431 490 921<br />
Grade 7/Standard 5/ ABET 3 626 725 1 351 94 131 225 9 14 23 9 14 22 738 884 1 621<br />
Grade 8/Standard 6/Form 1 843 866 1 709 129 145 274 32 36 67 35 40 75 1 039 1 087 2 126<br />
Grade 9/Standard 7/Form 2/ ABET 4 851 841 1 692 151 132 284 12 16 29 23 34 56 1 038 1 023 2 061<br />
Grade 10/ Standard 8/ Form 3 1 202 1 253 2 455 200 214 414 48 42 90 156 203 359 1 607 1 712 3 319<br />
Grade 11/ Standard 9/ Form 4 1 309 1 573 2 882 99 116 215 21 26 47 29 42 71 1 458 1 758 3 216<br />
Grade 12/Standard 10/Form 5/Matric (No Exemption) 2 469 2 669 5 137 302 363 664 171 163 334 531 639 1 171 3 473 3 834 7 306<br />
Grade 12/Standard 10/Form 5/Matric (Exemption *) 166 162 328 35 46 81 22 24 47 99 113 213 323 346 669<br />
NTC 1/ N1/NC (V) Level 2 19 8 27 * *. * * * * 3 * 4 24 8 32<br />
NTC 2/ N2/ NC (V) Level 3 10 11 22 3 * 4 * * * 11 4 14 25 16 41<br />
NTC 3/ N3/NC (V)/Level 4 19 17 36 8 3 11 3 * 3 33 3 37 64 23 86<br />
N4/NTC 4 22 8 30 1 * 1 * * * 14 2 16 38 10 48<br />
N5/NTC 5 8 10 17 * * 2 * * * 6 3 9 16 14 30<br />
N6/NTC 6 24 21 45 2 2 3 * * * 18 3 21 45 27 72<br />
Certificate with less than Grade 12/Std 10 13 21 34 4 2 6 * * * 6 6 12 24 30 54<br />
<strong>General</strong> Household Survey, July 2011


