

General household survey - Statistics South Africa
General household survey - Statistics South Africa
General household survey - Statistics South Africa

You also want an ePaper? Increase the reach of your titles
YUMPU automatically turns print PDFs into web optimized ePapers that Google loves.
<strong>Statistics</strong> <strong>South</strong> <strong>Africa</strong> 136<br />
P0318<br />
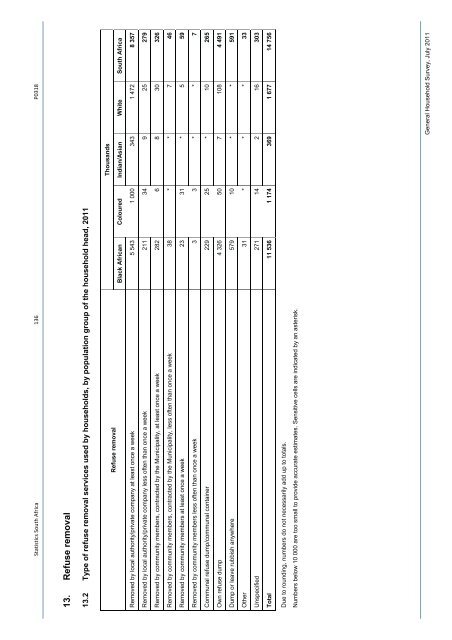
13. Refuse removal<br />
13.2 Type of refuse removal services used by <strong>household</strong>s, by population group of the <strong>household</strong> head, 2011<br />
Thousands<br />
Refuse removal<br />
Black <strong>Africa</strong>n Coloured Indian/Asian White <strong>South</strong> <strong>Africa</strong><br />
Removed by local authority/private company at least once a week 5 543 1 000 343 1 472 8 357<br />
Removed by local authority/private company less often than once a week 211 34 9 25 279<br />
Removed by community members, contracted by the Municipality, at least once a week 282 6 8 30 326<br />
Removed by community members, contracted by the Municipality, less often than once a week 38 * * 7 46<br />
Removed by community members at least once a week 23 31 * 5 59<br />
Removed by community members less often than once a week 3 3 * * 7<br />
Communal refuse dump/communal container 229 25 * 10 265<br />
Own refuse dump 4 326 50 7 108 4 491<br />
Dump or leave rubbish anywhere 579 10 * * 591<br />
Other 31 * * * 33<br />
Unspecified 271 14 2 16 303<br />
Total 11 536 1 174 369 1 677 14 756<br />
Due to rounding, numbers do not necessarily add up to totals.<br />
Numbers below 10 000 are too small to provide accurate estimates. Sensitive cells are indicated by an asterisk.<br />
<strong>General</strong> Household Survey, July 2011


