

General household survey - Statistics South Africa
General household survey - Statistics South Africa
General household survey - Statistics South Africa

You also want an ePaper? Increase the reach of your titles
YUMPU automatically turns print PDFs into web optimized ePapers that Google loves.
<strong>Statistics</strong> <strong>South</strong> <strong>Africa</strong> 77<br />
P0318<br />
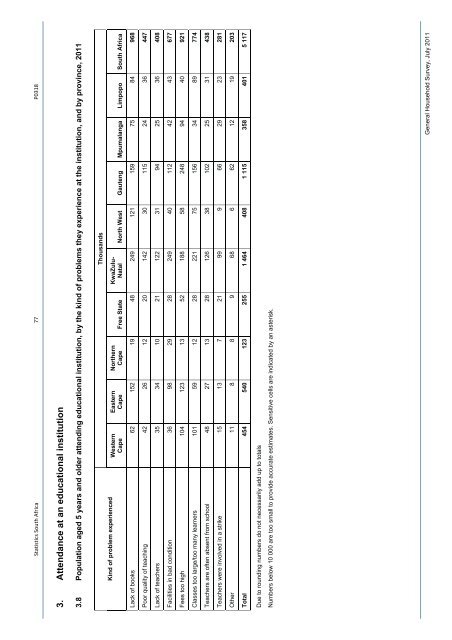
3. Attendance at an educational institution<br />
3.8 Population aged 5 years and older attending educational institution, by the kind of problems they experience at the institution, and by province, 2011<br />
Thousands<br />
KwaZulu-<br />
Natal North West Gauteng Mpumalanga Limpopo <strong>South</strong> <strong>Africa</strong><br />
Northern<br />
Cape Free State<br />
Eastern<br />
Cape<br />
Western<br />
Cape<br />
Kind of problem experienced<br />
Lack of books 62 152 19 48 249 121 159 75 84 968<br />
Poor quality of teaching 42 26 12 20 142 30 115 24 36 447<br />
Lack of teachers 35 34 10 21 122 31 94 25 36 408<br />
Facilities in bad condition 36 98 29 28 249 40 112 42 43 677<br />
Fees too high 104 123 13 52 188 58 248 94 40 921<br />
Classes too large/too many learners 101 59 12 28 221 75 156 34 89 774<br />
Teachers are often absent from school 48 27 13 28 126 38 102 25 31 438<br />
Teachers were involved in a strike 15 13 7 21 99 9 66 29 23 281<br />
Other 11 8 8 9 68 6 62 12 19 203<br />
Total 454 540 123 255 1 464 408 1 115 358 401 5 117<br />
Due to rounding numbers do not necessarily add up to totals<br />
Numbers below 10 000 are too small to provide accurate estimates. Sensitive cells are indicated by an asterisk.<br />
<strong>General</strong> Household Survey, July 2011


