

General household survey - Statistics South Africa
General household survey - Statistics South Africa
General household survey - Statistics South Africa

You also want an ePaper? Increase the reach of your titles
YUMPU automatically turns print PDFs into web optimized ePapers that Google loves.
<strong>Statistics</strong> <strong>South</strong> <strong>Africa</strong> 142<br />
P0318<br />
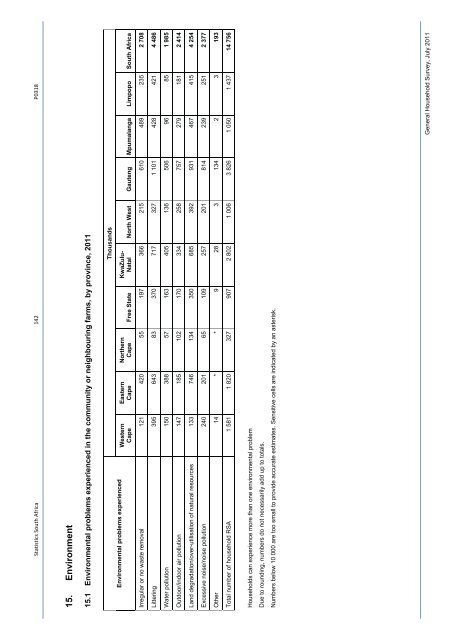
15. Environment<br />
15.1 Environmental problems experienced in the community or neighbouring farms, by province, 2011<br />
Thousands<br />
KwaZulu-<br />
Natal North West Gauteng Mpumalanga Limpopo <strong>South</strong> <strong>Africa</strong><br />
Northern<br />
Cape Free State<br />
Eastern<br />
Cape<br />
Western<br />
Cape<br />
Environmental problems experienced<br />
Irregular or no waste removal 121 420 55 197 366 215 610 489 235 2 708<br />
Littering 395 643 83 370 717 327 1 101 428 421 4 486<br />
Water pollution 150 388 57 163 405 136 506 96 85 1 985<br />
Outdoor/indoor air pollution 147 185 102 170 334 258 757 279 181 2 414<br />
Land degradation/over-utilisation of natural resources 133 746 134 350 685 392 931 467 415 4 254<br />
Excessive noise/noise pollution 240 201 65 109 257 201 814 239 251 2 377<br />
Other 14 * * 9 28 3 134 2 3 193<br />
Total number of <strong>household</strong> RSA 1 581 1 820 327 907 2 802 1 006 3 826 1 050 1 437 14 756<br />
Households can experience more than one environmental problem<br />
Due to rounding, numbers do not necessarily add up to totals.<br />
Numbers below 10 000 are too small to provide accurate estimates. Sensitive cells are indicated by an asterisk.<br />
<strong>General</strong> Household Survey, July 2011


