

General household survey - Statistics South Africa
General household survey - Statistics South Africa
General household survey - Statistics South Africa

You also want an ePaper? Increase the reach of your titles
YUMPU automatically turns print PDFs into web optimized ePapers that Google loves.
<strong>Statistics</strong> <strong>South</strong> <strong>Africa</strong> 85<br />
P0318<br />
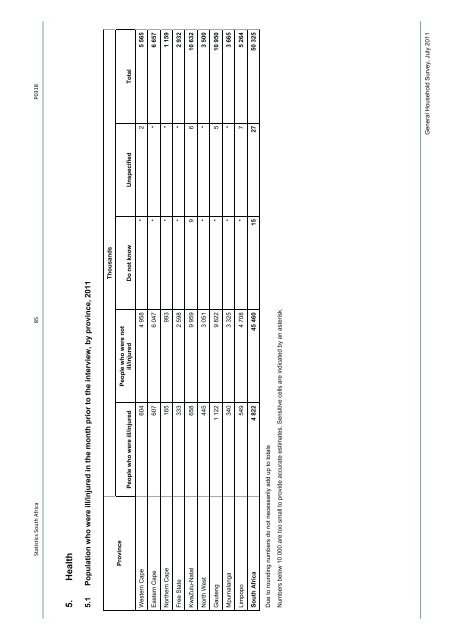
5. Health<br />
5.1 Population who were ill/injured in the month prior to the interview, by province, 2011<br />
Thousands<br />
People who were not<br />
ill/injured Do not know Unspecified Total<br />
Province<br />
People who were ill/injured<br />
Western Cape 604 4 958 * 2 5 565<br />
Eastern Cape 607 6 047 * * 6 657<br />
Northern Cape 165 993 * * 1 159<br />
Free State 333 2 598 * * 2 932<br />
KwaZulu-Natal 658 9 959 9 6 10 632<br />
North West 445 3 051 * * 3 500<br />
Gauteng 1 122 9 822 * 5 10 950<br />
Mpumalanga 340 3 325 * * 3 665<br />
Limpopo 549 4 708 * 7 5 264<br />
<strong>South</strong> <strong>Africa</strong> 4 822 45 460 15 27 50 325<br />
Due to rounding numbers do not necessarily add up to totals<br />
Numbers below 10 000 are too small to provide accurate estimates. Sensitive cells are indicated by an asterisk.<br />
<strong>General</strong> Household Survey, July 2011


