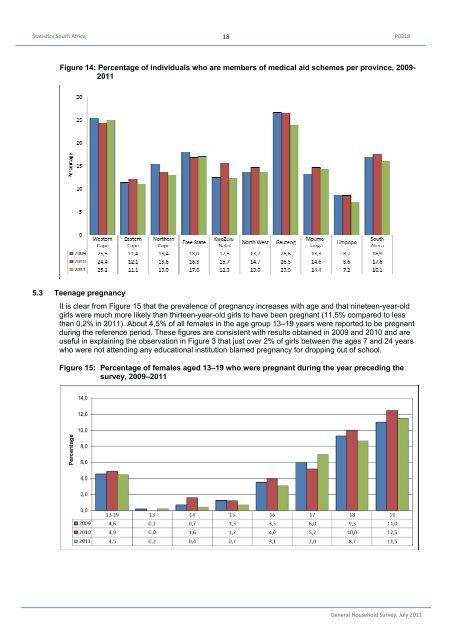
<strong>Statistics</strong> <strong>South</strong> <strong>Africa</strong> 17 P0318 Table 5: Level of satisfaction with public and private health care, 2011 (concluded) Type of institution Statistic Very satisfied Somewhat satisfied Neither satisfied nor dissatisfied Somewhat dissatisfied Very dissatisfied Western Cape Eastern Cape Northern Cape Free State KwaZulu- Natal Private health care Province Number 670 317 76 307 505 221 1 167 263 169 3 695 Per cent 92,0 98,6 89,9 95,3 85,9 89,9 92,4 94,8 97,2 92,9 Number 47 3 5 12 41 16 59 6 2 191 Per cent 6,4 0,9 6,2 3,6 7,0 6,6 4,7 2,1 0,9 4,3 Number 6 0 2 1 9 3 8 2 2 32 Per cent 0,8 0,0 2,3 0,4 1,5 1,2 0,6 0,6 1,3 1,0 Number 3 1 1 1 5 1 14 2 0 28 Per cent 0,4 0,4 1,3 0,4 0,8 0,6 1,1 0,7 0,0 0,6 Number 3 0 0 1 29 4 15 5 1 58 Per cent 0,4 0,0 0,4 0,3 4,9 1,8 1,2 1,8 0,5 1,3 Totals exclude unspecified cases 5.2 Medical aid coverage Table 6 shows that the percentage of individuals covered by medical aid declined to 16% in 2011 after it had been increasing consistently between 2006 and 2010. Although the percentage of individuals covered by medical aid schemes increased by only 0,4 percentage points since 2002, almost a million more individuals were covered by medical aid schemes in 2011 compared to 2002. Nearly a quarter (22,8%) of <strong>South</strong> <strong>Africa</strong>n <strong>household</strong>s had at least one member who belonged to a medical aid scheme. Table 6: Medical aid coverage, 2011 Indicator (Numbers in Year thousands) Number covered by a 2002 2003 2004 2005 2006 2007 2008 2009 2010 2011 medical aid scheme Number not covered by 7 063 6 894 7 033 6 618 6 599 6 920 7 797 8 293 8 742 8 058 medical aid scheme 38 280 39 160 39 546 40 497 41 070 41 142 40 844 40 743 40 860 42 028 Subtotal Percentage covered by 45 343 46 054 46 579 47 114 47 670 48 062 49 035 49 035 49 602 50 086 a medical aid scheme 15,6 15,0 15,1 14,0 13,8 14,4 16,0 16,9 17,5 16,1 Do not know 137 56 58 43 100 134 100 19 23 18 Unspecified 53 6 28 41 51 61 51 327 244 221 Total population 45 533 46 116 46 665 47 198 47 821 48 257 48 793 49 382 49 869 50 325 White individuals remain much more likely to belong to a medical aid than members of other population groups. While almost 69,7% of the white population belonged to some medical scheme, only 41,1% of the Indian/Asian, 20,3% of the coloured and 8,9% of the black <strong>Africa</strong>n population groups were covered by such schemes at the time the <strong>survey</strong> was conducted in 2011. Figure 14 reveals that Western Cape (25,1%) and Gauteng (23,9%) contained the highest percentage of medical aid members while Limpopo (7,2%) and Eastern Cape (11,1%) had the lowest proportion of medical aid membership. Noticeable drops in the percentage of medical aid members are observed in all provinces between 2002 and 2011 except Western Cape and Northern Cape where slight increases occurred. North West Gauteng Mpumalanga Limpopo <strong>South</strong> <strong>Africa</strong> <strong>General</strong> Household Survey, July 2011
<strong>Statistics</strong> <strong>South</strong> <strong>Africa</strong> 18 P0318 Figure 14: Percentage of individuals who are members of medical aid schemes per province, 2009- 2011 5.3 Teenage pregnancy It is clear from Figure 15 that the prevalence of pregnancy increases with age and that nineteen-year-old girls were much more likely than thirteen-year-old girls to have been pregnant (11,5% compared to less than 0,2% in 2011). About 4,5% of all females in the age group 13–19 years were reported to be pregnant during the reference period. These figures are consistent with results obtained in 2009 and 2010 and are useful in explaining the observation in Figure 3 that just over 2% of girls between the ages 7 and 24 years who were not attending any educational institution blamed pregnancy for dropping out of school. Figure 15: Percentage of females aged 13–19 who were pregnant during the year preceding the <strong>survey</strong>, 2009–2011 <strong>General</strong> Household Survey, July 2011