

General household survey - Statistics South Africa
General household survey - Statistics South Africa
General household survey - Statistics South Africa

You also want an ePaper? Increase the reach of your titles
YUMPU automatically turns print PDFs into web optimized ePapers that Google loves.
<strong>Statistics</strong> <strong>South</strong> <strong>Africa</strong> 68<br />
P0318<br />
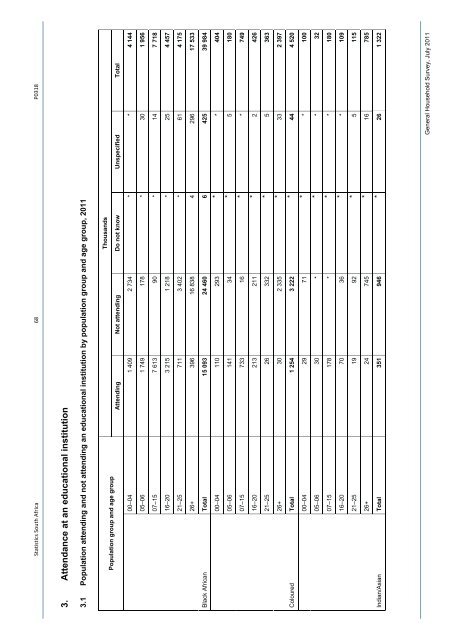
3. Attendance at an educational institution<br />
3.1 Population attending and not attending an educational institution by population group and age group, 2011<br />
Thousands<br />
Population group and age group<br />
Attending Not attending Do not know Unspecified Total<br />
00–04 1 409 2 734 * * 4 144<br />
05–06 1 749 178 * 30 1 956<br />
07–15 7 613 90 * 14 7 718<br />
16–20 3 215 1 218 * 25 4 457<br />
21–25 711 3 402 * 61 4 175<br />
26+ 396 16 838 4 296 17 533<br />
Total 15 093 24 460 6 425 39 984<br />
Black <strong>Africa</strong>n<br />
00–04 110 293 * * 404<br />
05–06 141 34 * 5 180<br />
07–15 733 16 * * 749<br />
16–20 213 211 * 2 426<br />
21–25 26 332 * 5 363<br />
26+ 30 2 335 * 33 2 397<br />
Total 1 254 3 222 * 44 4 520<br />
Coloured<br />
00–04 29 71 * * 100<br />
05–06 30 * * * 32<br />
07–15 178 * * * 180<br />
16–20 70 36 * * 109<br />
21–25 19 92 * 5 115<br />
26+ 24 745 * 16 785<br />
Total 351 946 * 26 1 322<br />
Indian/Asian<br />
<strong>General</strong> Household Survey, July 2011


