

General household survey - Statistics South Africa
General household survey - Statistics South Africa
General household survey - Statistics South Africa

Create successful ePaper yourself
Turn your PDF publications into a flip-book with our unique Google optimized e-Paper software.
<strong>Statistics</strong> <strong>South</strong> <strong>Africa</strong> 81<br />
P0318<br />
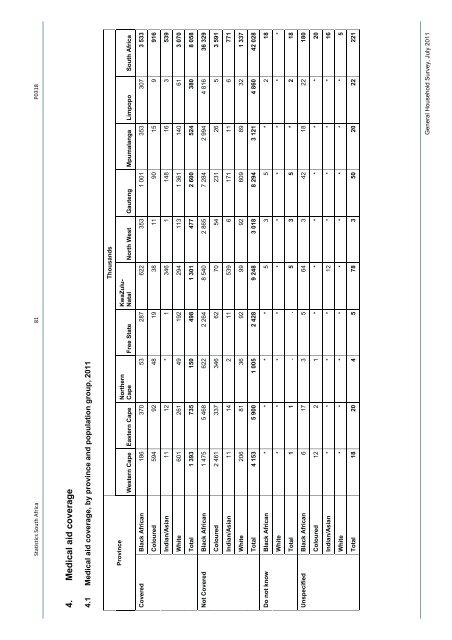
4. Medical aid coverage<br />
4.1 Medical aid coverage, by province and population group, 2011<br />
Thousands<br />
KwaZulu-<br />
Natal North West Gauteng Mpumalanga Limpopo <strong>South</strong> <strong>Africa</strong><br />
Northern<br />
Cape Free State<br />
Province<br />
Western Cape Eastern Cape<br />
Covered Black <strong>Africa</strong>n 186 370 53 287 622 353 1 001 353 307 3 533<br />
Coloured 594 92 48 19 38 11 90 15 9 916<br />
Indian/Asian 11 12 * 1 346 1 148 16 3 539<br />
White 601 261 49 192 294 113 1 361 140 61 3 070<br />
Total 1 393 735 150 498 1 301 477 2 600 524 380 8 058<br />
Not Covered Black <strong>Africa</strong>n 1 475 5 468 622 2 264 8 540 2 865 7 284 2 994 4 816 36 329<br />
Coloured 2 461 337 346 62 70 54 231 26 5 3 591<br />
Indian/Asian 11 14 2 11 539 6 171 11 6 771<br />
White 206 81 36 92 99 92 609 89 32 1 337<br />
Total 4 153 5 900 1 005 2 428 9 248 3 018 8 294 3 121 4 860 42 028<br />
Do not know Black <strong>Africa</strong>n * * * * 5 3 5 * 2 18<br />
White * * * * * * * * * *<br />
Total 1 1 . . 5 3 5 * 2 18<br />
Unspecified Black <strong>Africa</strong>n 6 17 3 5 64 3 42 18 22 180<br />
Coloured 12 2 1 * * * * * * 20<br />
Indian/Asian * * * * 12 * * * * 16<br />
White * * * * * * * * * 5<br />
Total 18 20 4 5 78 3 50 20 22 221<br />
<strong>General</strong> Household Survey, July 2011


