

General household survey - Statistics South Africa
General household survey - Statistics South Africa
General household survey - Statistics South Africa

Create successful ePaper yourself
Turn your PDF publications into a flip-book with our unique Google optimized e-Paper software.
<strong>Statistics</strong> <strong>South</strong> <strong>Africa</strong> 72<br />
P0318<br />
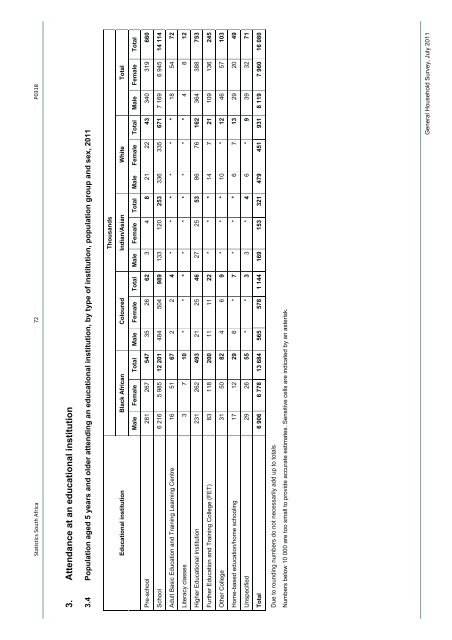
3. Attendance at an educational institution<br />
3.4 Population aged 5 years and older attending an educational institution, by type of institution, population group and sex, 2011<br />
Thousands<br />
Black <strong>Africa</strong>n Coloured Indian/Asian White Total<br />
Educational institution<br />
Male Female Total Male Female Total Male Female Total Male Female Total Male Female Total<br />
Pre-school 281 267 547 35 26 62 3 4 8 21 22 43 340 319 660<br />
School 6 216 5 985 12 201 484 504 989 133 120 253 336 335 671 7 169 6 945 14 114<br />
Adult Basic Education and Training Learning Centre 16 51 67 2 2 4 * * * * * * 18 54 72<br />
Literacy classes 3 7 10 * * * * * * * * * 4 8 12<br />
Higher Educational Institution 231 262 493 21 25 46 27 25 53 86 76 162 364 388 753<br />
Further Education and Training College (FET) 83 118 200 11 11 22 * * * 14 7 21 109 136 245<br />
Other College 31 50 82 4 6 9 * * * 10 * 12 46 57 103<br />
Home-based education/home schooling 17 12 29 6 * 7 * * * 6 7 13 29 20 49<br />
Unspecified 29 26 55 * * 3 3 * 4 6 * 9 39 32 71<br />
Total 6 906 6 778 13 684 565 578 1 144 169 153 321 479 451 931 8 119 7 960 16 080<br />
Due to rounding numbers do not necessarily add up to totals<br />
Numbers below 10 000 are too small to provide accurate estimates. Sensitive cells are indicated by an asterisk.<br />
<strong>General</strong> Household Survey, July 2011


