General household survey - Statistics South Africa
General household survey - Statistics South Africa
General household survey - Statistics South Africa
Create successful ePaper yourself
Turn your PDF publications into a flip-book with our unique Google optimized e-Paper software.
<strong>Statistics</strong> <strong>South</strong> <strong>Africa</strong> vi P0318<br />
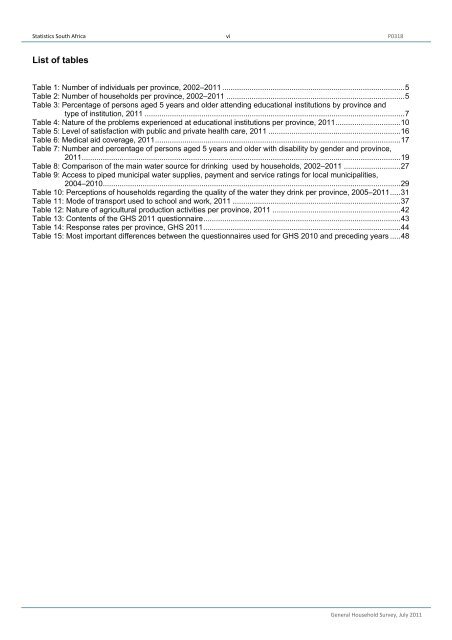
List of tables<br />
Table 1: Number of individuals per province, 2002–2011 ....................................................................................... 5<br />
Table 2: Number of <strong>household</strong>s per province, 2002–2011 ..................................................................................... 5<br />
Table 3: Percentage of persons aged 5 years and older attending educational institutions by province and<br />
type of institution, 2011 ............................................................................................................................ 7<br />
Table 4: Nature of the problems experienced at educational institutions per province, 2011 ............................... 10<br />
Table 5: Level of satisfaction with public and private health care, 2011 ............................................................... 16<br />
Table 6: Medical aid coverage, 2011 ..................................................................................................................... 17<br />
Table 7: Number and percentage of persons aged 5 years and older with disability by gender and province,<br />
2011 ........................................................................................................................................................ 19<br />
Table 8: Comparison of the main water source for drinking used by <strong>household</strong>s, 2002–2011 ........................... 27<br />
Table 9: Access to piped municipal water supplies, payment and service ratings for local municipalities,<br />
2004–2010 .............................................................................................................................................. 29<br />
Table 10: Perceptions of <strong>household</strong>s regarding the quality of the water they drink per province, 2005–2011 ..... 31<br />
Table 11: Mode of transport used to school and work, 2011 ................................................................................ 37<br />
Table 12: Nature of agricultural production activities per province, 2011 ............................................................. 42<br />
Table 13: Contents of the GHS 2011 questionnaire .............................................................................................. 43<br />
Table 14: Response rates per province, GHS 2011 .............................................................................................. 44<br />
Table 15: Most important differences between the questionnaires used for GHS 2010 and preceding years ..... 48<br />
<strong>General</strong> Household Survey, July 2011


