

General household survey - Statistics South Africa
General household survey - Statistics South Africa
General household survey - Statistics South Africa

You also want an ePaper? Increase the reach of your titles
YUMPU automatically turns print PDFs into web optimized ePapers that Google loves.
<strong>Statistics</strong> <strong>South</strong> <strong>Africa</strong> 143<br />
P0318<br />
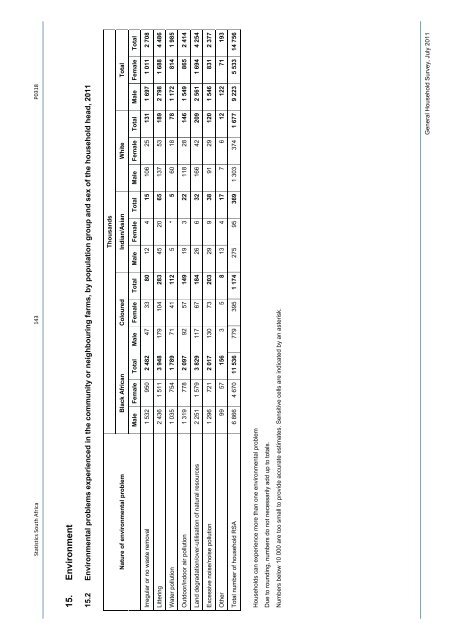
15. Environment<br />
15.2 Environmental problems experienced in the community or neighbouring farms, by population group and sex of the <strong>household</strong> head, 2011<br />
Thousands<br />
Black <strong>Africa</strong>n Coloured Indian/Asian White Total<br />
Nature of environmental problem<br />
Male Female Total Male Female Total Male Female Total Male Female Total Male Female Total<br />
Irregular or no waste removal 1 532 950 2 482 47 33 80 12 4 15 106 25 131 1 697 1 011 2 708<br />
Littering 2 436 1 511 3 948 179 104 283 45 20 65 137 53 189 2 798 1 688 4 486<br />
Water pollution 1 035 754 1 789 71 41 112 5 * 5 60 18 78 1 172 814 1 985<br />
Outdoor/indoor air pollution 1 319 778 2 097 92 57 149 19 3 22 118 28 146 1 549 865 2 414<br />
Land degradation/over-utilisation of natural resources 2 251 1 579 3 829 117 67 184 26 6 32 166 42 209 2 561 1 694 4 254<br />
Excessive noise/noise pollution 1 296 721 2 017 130 73 203 29 9 38 91 29 120 1 546 831 2 377<br />
Other 99 57 156 3 5 8 13 4 17 7 6 12 122 71 193<br />
Total number of <strong>household</strong> RSA 6 866 4 670 11 536 779 395 1 174 275 95 369 1 303 374 1 677 9 223 5 533 14 756<br />
Households can experience more than one environmental problem<br />
Due to rounding, numbers do not necessarily add up to totals.<br />
Numbers below 10 000 are too small to provide accurate estimates. Sensitive cells are indicated by an asterisk.<br />
<strong>General</strong> Household Survey, July 2011


