

General household survey - Statistics South Africa
General household survey - Statistics South Africa
General household survey - Statistics South Africa

Create successful ePaper yourself
Turn your PDF publications into a flip-book with our unique Google optimized e-Paper software.
<strong>Statistics</strong> <strong>South</strong> <strong>Africa</strong> 24<br />
P0318<br />
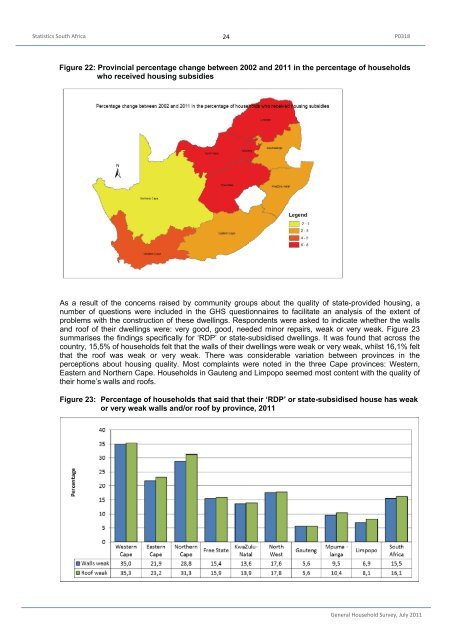
Figure 22: Provincial percentage change between 2002 and 2011 in the percentage of <strong>household</strong>s<br />
who received housing subsidies<br />
As a result of the concerns raised by community groups about the quality of state-provided housing, a<br />
number of questions were included in the GHS questionnaires to facilitate an analysis of the extent of<br />
problems with the construction of these dwellings. Respondents were asked to indicate whether the walls<br />
and roof of their dwellings were: very good, good, needed minor repairs, weak or very weak. Figure 23<br />
summarises the findings specifically for ‘RDP’ or state-subsidised dwellings. It was found that across the<br />
country, 15,5% of <strong>household</strong>s felt that the walls of their dwellings were weak or very weak, whilst 16,1% felt<br />
that the roof was weak or very weak. There was considerable variation between provinces in the<br />
perceptions about housing quality. Most complaints were noted in the three Cape provinces: Western,<br />
Eastern and Northern Cape. Households in Gauteng and Limpopo seemed most content with the quality of<br />
their home’s walls and roofs.<br />
Figure 23: Percentage of <strong>household</strong>s that said that their ‘RDP’ or state-subsidised house has weak<br />
or very weak walls and/or roof by province, 2011<br />
<strong>General</strong> Household Survey, July 2011


