

General household survey - Statistics South Africa
General household survey - Statistics South Africa
General household survey - Statistics South Africa

You also want an ePaper? Increase the reach of your titles
YUMPU automatically turns print PDFs into web optimized ePapers that Google loves.
<strong>Statistics</strong> <strong>South</strong> <strong>Africa</strong> 100<br />
P0318<br />
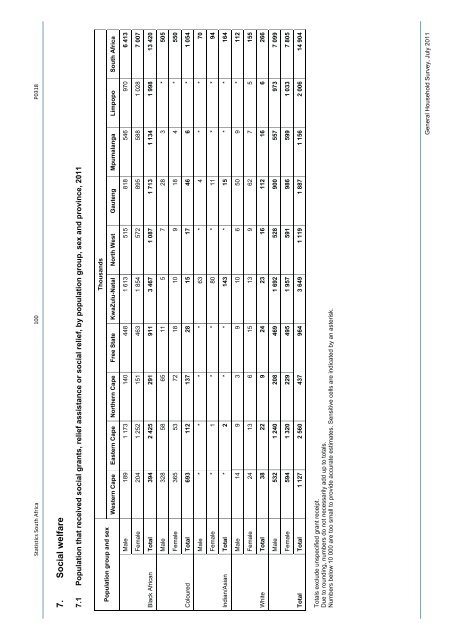
7. Social welfare<br />
7.1 Population that received social grants, relief assistance or social relief, by population group, sex and province, 2011<br />
Thousands<br />
Population group and sex<br />
Western Cape Eastern Cape Northern Cape Free State KwaZulu-Natal North West Gauteng Mpumalanga Limpopo <strong>South</strong> <strong>Africa</strong><br />
Male 189 1 173 140 448 1 613 515 818 546 970 6 413<br />
Female 204 1 252 151 463 1 854 572 895 588 1 028 7 007<br />
Total 394 2 425 291 911 3 467 1 087 1 713 1 134 1 998 13 420<br />
Black <strong>Africa</strong>n<br />
Male 328 58 65 11 5 7 28 3 * 505<br />
Female 365 53 72 18 10 9 18 4 * 550<br />
Total 693 112 137 28 15 17 46 6 * 1 054<br />
Coloured<br />
Male * * * * 63 * 4 * * 70<br />
Female * 1 * * 80 * 11 * * 94<br />
Total * 2 * * 143 * 15 * * 164<br />
Indian/Asian<br />
Male 14 9 3 9 10 6 50 9 * 112<br />
Female 24 13 6 15 13 9 62 7 5 155<br />
Total 38 22 9 24 23 16 112 16 6 266<br />
White<br />
Male 532 1 240 208 469 1 692 528 900 557 973 7 099<br />
Female 594 1 320 229 495 1 957 591 986 599 1 033 7 805<br />
Total 1 127 2 560 437 964 3 649 1 119 1 887 1 156 2 006 14 904<br />
Total<br />
Totals exclude unspecified grant receipt.<br />
Due to rounding, numbers do not necessarily add up to totals.<br />
Numbers below 10 000 are too small to provide accurate estimates. Sensitive cells are indicated by an asterisk.<br />
<strong>General</strong> Household Survey, July 2011


