

General household survey - Statistics South Africa
General household survey - Statistics South Africa
General household survey - Statistics South Africa

You also want an ePaper? Increase the reach of your titles
YUMPU automatically turns print PDFs into web optimized ePapers that Google loves.
<strong>Statistics</strong> <strong>South</strong> <strong>Africa</strong> 26<br />
P0318<br />
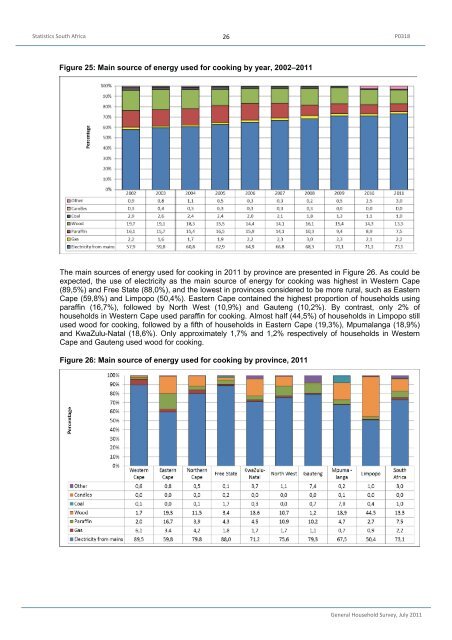
Figure 25: Main source of energy used for cooking by year, 2002–2011<br />
The main sources of energy used for cooking in 2011 by province are presented in Figure 26. As could be<br />
expected, the use of electricity as the main source of energy for cooking was highest in Western Cape<br />
(89,5%) and Free State (88,0%), and the lowest in provinces considered to be more rural, such as Eastern<br />
Cape (59,8%) and Limpopo (50,4%). Eastern Cape contained the highest proportion of <strong>household</strong>s using<br />
paraffin (16,7%), followed by North West (10,9%) and Gauteng (10,2%). By contrast, only 2% of<br />
<strong>household</strong>s in Western Cape used paraffin for cooking. Almost half (44,5%) of <strong>household</strong>s in Limpopo still<br />
used wood for cooking, followed by a fifth of <strong>household</strong>s in Eastern Cape (19,3%), Mpumalanga (18,9%)<br />
and KwaZulu-Natal (18,6%). Only approximately 1,7% and 1,2% respectively of <strong>household</strong>s in Western<br />
Cape and Gauteng used wood for cooking.<br />
Figure 26: Main source of energy used for cooking by province, 2011<br />
<strong>General</strong> Household Survey, July 2011


