

General household survey - Statistics South Africa
General household survey - Statistics South Africa
General household survey - Statistics South Africa

You also want an ePaper? Increase the reach of your titles
YUMPU automatically turns print PDFs into web optimized ePapers that Google loves.
<strong>Statistics</strong> <strong>South</strong> <strong>Africa</strong> 67<br />
P0318<br />
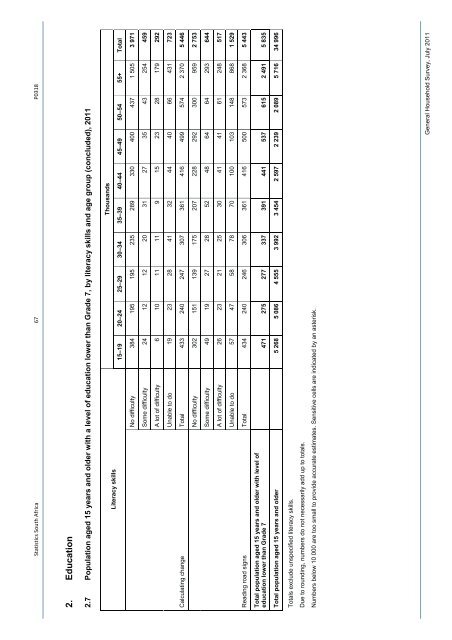
2. Education<br />
2.7 Population aged 15 years and older with a level of education lower than Grade 7, by literacy skills and age group (concluded), 2011<br />
Thousands<br />
Literacy skills<br />
15–19 20–24 25–29 30–34 35–39 40–44 45–49 50–54 55+ Total<br />
No difficulty 384 195 195 235 289 330 400 437 1 505 3 971<br />
Some difficulty 24 12 12 20 31 27 35 43 254 459<br />
A lot of difficulty 6 10 11 11 9 15 23 28 179 292<br />
Unable to do 19 23 28 41 32 44 40 66 431 723<br />
Total 433 240 247 307 361 416 499 574 2 370 5 446<br />
Calculating change<br />
No difficulty 302 151 139 175 207 228 292 300 959 2 753<br />
Some difficulty 49 19 27 28 52 48 64 64 293 644<br />
A lot of difficulty 26 23 21 25 30 41 41 61 248 517<br />
Unable to do 57 47 58 78 70 100 103 148 868 1 529<br />
Total 434 240 246 306 361 416 500 573 2 368 5 443<br />
Reading road signs<br />
Total population aged 15 years and older with level of<br />
education lower than Grade 7 471 275 277 337 391 441 537 615 2 491 5 835<br />
Total population aged 15 years and older 5 268 5 086 4 555 3 992 3 454 2 597 2 239 2 089 5 716 34 996<br />
Totals exclude unspecified literacy skills.<br />
Due to rounding, numbers do not necessarily add up to totals.<br />
Numbers below 10 000 are too small to provide accurate estimates. Sensitive cells are indicated by an asterisk.<br />
<strong>General</strong> Household Survey, July 2011


