

General household survey - Statistics South Africa
General household survey - Statistics South Africa
General household survey - Statistics South Africa

Create successful ePaper yourself
Turn your PDF publications into a flip-book with our unique Google optimized e-Paper software.
<strong>Statistics</strong> <strong>South</strong> <strong>Africa</strong> 10<br />
P0318<br />
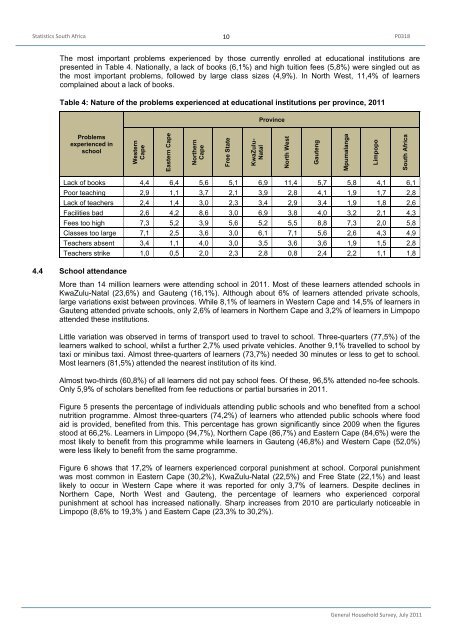
The most important problems experienced by those currently enrolled at educational institutions are<br />
presented in Table 4. Nationally, a lack of books (6,1%) and high tuition fees (5,8%) were singled out as<br />
the most important problems, followed by large class sizes (4,9%). In North West, 11,4% of learners<br />
complained about a lack of books.<br />
Table 4: Nature of the problems experienced at educational institutions per province, 2011<br />
Problems<br />
experienced in<br />
school<br />
Western<br />
Cape<br />
Eastern Cape<br />
Northern<br />
Cape<br />
Free State<br />
KwaZulu-<br />
Natal<br />
Province<br />
Lack of books 4,4 6,4 5,6 5,1 6,9 11,4 5,7 5,8 4,1 6,1<br />
Poor teaching 2,9 1,1 3,7 2,1 3,9 2,8 4,1 1,9 1,7 2,8<br />
Lack of teachers 2,4 1,4 3,0 2,3 3,4 2,9 3,4 1,9 1,8 2,6<br />
Facilities bad 2,6 4,2 8,6 3,0 6,9 3,8 4,0 3,2 2,1 4,3<br />
Fees too high 7,3 5,2 3,9 5,6 5,2 5,5 8,8 7,3 2,0 5,8<br />
Classes too large 7,1 2,5 3,6 3,0 6,1 7,1 5,6 2,6 4,3 4,9<br />
Teachers absent 3,4 1,1 4,0 3,0 3,5 3,6 3,6 1,9 1,5 2,8<br />
Teachers strike 1,0 0,5 2,0 2,3 2,8 0,8 2,4 2,2 1,1 1,8<br />
4.4 School attendance<br />
More than 14 million learners were attending school in 2011. Most of these learners attended schools in<br />
KwaZulu-Natal (23,6%) and Gauteng (16,1%). Although about 6% of learners attended private schools,<br />
large variations exist between provinces. While 8,1% of learners in Western Cape and 14,5% of learners in<br />
Gauteng attended private schools, only 2,6% of learners in Northern Cape and 3,2% of learners in Limpopo<br />
attended these institutions.<br />
Little variation was observed in terms of transport used to travel to school. Three-quarters (77,5%) of the<br />
learners walked to school, whilst a further 2,7% used private vehicles. Another 9,1% travelled to school by<br />
taxi or minibus taxi. Almost three-quarters of learners (73,7%) needed 30 minutes or less to get to school.<br />
Most learners (81,5%) attended the nearest institution of its kind.<br />
Almost two-thirds (60,8%) of all learners did not pay school fees. Of these, 96,5% attended no-fee schools.<br />
Only 5,9% of scholars benefited from fee reductions or partial bursaries in 2011.<br />
Figure 5 presents the percentage of individuals attending public schools and who benefited from a school<br />
nutrition programme. Almost three-quarters (74,2%) of learners who attended public schools where food<br />
aid is provided, benefited from this. This percentage has grown significantly since 2009 when the figures<br />
stood at 66,2%. Learners in Limpopo (94,7%), Northern Cape (86,7%) and Eastern Cape (84,6%) were the<br />
most likely to benefit from this programme while learners in Gauteng (46,8%) and Western Cape (52,0%)<br />
were less likely to benefit from the same programme.<br />
Figure 6 shows that 17,2% of learners experienced corporal punishment at school. Corporal punishment<br />
was most common in Eastern Cape (30,2%), KwaZulu-Natal (22,5%) and Free State (22,1%) and least<br />
likely to occur in Western Cape where it was reported for only 3,7% of learners. Despite declines in<br />
Northern Cape, North West and Gauteng, the percentage of learners who experienced corporal<br />
punishment at school has increased nationally. Sharp increases from 2010 are particularly noticeable in<br />
Limpopo (8,6% to 19,3% ) and Eastern Cape (23,3% to 30,2%).<br />
North West<br />
Gauteng<br />
Mpumalanga<br />
Limpopo<br />
<strong>South</strong> <strong>Africa</strong><br />
<strong>General</strong> Household Survey, July 2011


