- Page 1 and 2:
Summaries of Wildlife Research Find
- Page 3 and 4:
September 2008 State of Minnesota,
- Page 5 and 6:
The value of farm programs for prov
- Page 7 and 8:
Understanding variations in autumn
- Page 9 and 10:
MANAGING BOVINE TUBERCULOSIS IN WHI
- Page 11 and 12:
3 the lungs or chest cavity that we
- Page 15:
" Winter 2007 Deer Removal Location
- Page 19 and 20:
METHODS The MNDNR planned to sample
- Page 21 and 22:
Table 1. Bird species sampled for h
- Page 23:
Table 2 continued. Northern Pintail
- Page 27 and 28:
Blood was centrifuged and serum was
- Page 29 and 30:
Liver and Lung Culture A total of 1
- Page 31 and 32:
Positive results indicate exposure
- Page 35 and 36:
ESTIMATING WHITE-TAILED DEER ABUNDA
- Page 37 and 38:
or 2 quadrats. As a result, associa
- Page 39 and 40:
Table 1. Deer population and densit
- Page 41 and 42:
OBJECTIVE • To estimate density a
- Page 43 and 44:
35 Figure 1. Locations of trail cam
- Page 45 and 46:
EA hunters, identified in MNDNR 200
- Page 47 and 48:
percentage of EA hunters harvesting
- Page 49 and 50:
Deer harvested per 100 hunters 60 5
- Page 51 and 52:
FACTORS AFFECTING POPULATION INDICE
- Page 53 and 54:
following the first listening perio
- Page 55:
Table 1. Pheasant crowing and roads
- Page 59:
Index (males/stop) 4.00 3.00 2.00 1
- Page 62 and 63:
feeders (52%), depredation in cattl
- Page 64 and 65:
Table 3. Response for question 3: S
- Page 66 and 67:
Table 7. Responses for question 7:
- Page 68 and 69:
Table 10. Responses for question 10
- Page 70 and 71:
4. Do you need more information on
- Page 72 and 73:
EVIDENCE OF WILD TURKEYS IN MINNESO
- Page 74 and 75:
the upper valleys of the Mississipp
- Page 76:
68 Hoy, P. R. 1882. The larger wild
- Page 79 and 80:
71 songbirds, lagomorphs, rodents,
- Page 81 and 82:
73 (Cleary 1994). The first method
- Page 83 and 84:
Function #7: Public Relations with
- Page 85 and 86:
77 Evrard, J.O. 2000. Overwinter fo
- Page 87 and 88:
79 Murphy, R.K., N.F. Payne and R.K
- Page 89 and 90:
METHODS 81 We selected 36 study are
- Page 91 and 92:
Hens were relatively abundant durin
- Page 93 and 94:
85 Gabbert, A. E., A. P. Leif, J. R
- Page 95 and 96:
Table 3. Pheasant population indice
- Page 98 and 99:
Pheasants/100 Miles Pheasants/100 M
- Page 100 and 101:
RESULTS Thirty-six respondents comp
- Page 102 and 103:
Table 1. Mean rank (1 most importan
- Page 104 and 105:
EVIDENCE OF LEAD SHOT PROBLEMS FOR
- Page 106 and 107:
Wildlife Species Ingesting Lead Sho
- Page 108 and 109:
Michigan Department of Environmenta
- Page 110 and 111:
102 Battaglia, A., S. Ghidini, G. C
- Page 112 and 113:
104 Friend, M. and J.C. Franson (ed
- Page 114 and 115:
106 Lemay, A., P. McNicholl, and R.
- Page 116 and 117:
108 Pain, D.J., I. Carter, A.W. Sai
- Page 118 and 119:
110 Tsuji, L.S., & N. Nieboer. 1997
- Page 120 and 121:
SPECIES SCIENTIFIC NAME REFERENCE L
- Page 122 and 123:
SPECIES SCIENTIFIC NAME REFERENCE L
- Page 124 and 125:
NONTOXIC AND LEAD SHOT LITERATURE R
- Page 126 and 127:
Brown, C.S., J.Luebbert, D. Mulcahy
- Page 128 and 129:
CWS (Canadian Wildlife Service). 19
- Page 130 and 131:
European Commission Enterprise Dire
- Page 132 and 133:
124 Haldimann, M., A. Baumgartner,
- Page 134 and 135:
Johansen, P., G. Asmund, and F. Rig
- Page 136 and 137:
Lance, V.A., T.R. Horn, R.M. Elsey
- Page 138 and 139:
Mateo, R., M. Rodríguez-de la Cruz
- Page 140 and 141:
Ochiai, K., T. Kimura, K. Uematsu,
- Page 142 and 143:
Rocke, T. E., C. J. Brand, and J. G
- Page 144 and 145:
Sleet, R. B., and J. H. Soares, Jr.
- Page 146 and 147:
USEPA (United States Environmental
- Page 148 and 149:
140 - Reviews the international env
- Page 150 and 151:
142 - Summarizes current scientific
- Page 152 and 153:
144 Cummings School of Veterinary M
- Page 154 and 155:
146 - Lead poisoning of wildlife oc
- Page 156 and 157:
Lance, V.A., T.R. Horn, R.M. Elsey
- Page 158 and 159:
150 Michigan Department of Natural
- Page 160 and 161:
152 - Although all visible pellets
- Page 162 and 163:
154 Thomas, V. G., and Owen, M. 199
- Page 164 and 165:
SUPPORT FOR, ATTITUDES TOWARD, AND
- Page 166 and 167:
Statewide Estimates The study sampl
- Page 168 and 169:
Table 1: Response rates for each ma
- Page 170 and 171:
Table 7: Mean beliefs about and eva
- Page 172 and 173:
Protecting wildlife from lead poiso
- Page 174 and 175:
The southern portion of Minnesota i
- Page 176 and 177:
Although our domestic sheep weighed
- Page 178 and 179:
1 I 'T 'l 170 Figure 1. General loc
- Page 180 and 181:
172 Small Game Hunter Lead Shot Stu
- Page 182 and 183:
Executive Summary The purpose of th
- Page 184 and 185:
Table S-1: Gauge of shotgun used mo
- Page 186 and 187:
7 6 5 4 3 2 1 Support for/Oppositio
- Page 188 and 189:
7 6 5 4 3 2 1 Figure S-8: Concern a
- Page 190 and 191:
Conclusions 182 These survey result
- Page 192 and 193:
184 Small Game Hunter Lead Shot Stu
- Page 194 and 195:
Acknowledgements This study was a c
- Page 196 and 197:
Introduction Study Purpose and Obje
- Page 198 and 199:
Bohrnstedt and Mee, 2002, p. 414).
- Page 200 and 201:
Section 1: Small Game Hunting Activ
- Page 202 and 203:
Table 1-1: Proportion of respondent
- Page 204 and 205:
Table 1-7: How often do you hunt wi
- Page 206 and 207: Table 1-13: Involvement in small ga
- Page 208 and 209: Table 1-19: Involvement in small ga
- Page 210 and 211: Table 1-25: Involvement in small ga
- Page 212 and 213: Table 1-29: Involvement With and Co
- Page 214 and 215: Section 2: Shotgun and Shot Prefere
- Page 216 and 217: Table 2-4: Gauge of shotgun used mo
- Page 218 and 219: Table 2-10: Type of shot used most
- Page 220 and 221: Table 2-16: Number of boxes of shel
- Page 222 and 223: Table 2-22: Number of boxes of shel
- Page 224 and 225: Section 3: Beliefs, Attitudes, and
- Page 226 and 227: 218 Respondents were asked to indic
- Page 228 and 229: Table 3-4: Beliefs about using lead
- Page 230 and 231: Table 3-10: Beliefs about using lea
- Page 232 and 233: Table 3-16: Likelihood that banning
- Page 234 and 235: Table 3-22: Likelihood that banning
- Page 236 and 237: Table 3-28: How good or bad is the
- Page 238 and 239: Table 3-34: How good or bad is the
- Page 240 and 241: Table 3-40: Belief about whether MY
- Page 242 and 243: Table 3-46: Belief about whether TH
- Page 244 and 245: Table 3-52: I want to do what DUCKS
- Page 246 and 247: Section 4: Trust in the Minnesota D
- Page 248 and 249: Media Resources Table 4-4: Trust in
- Page 250 and 251: Media Resources Table 4-10: Trust a
- Page 252 and 253: Media Resources Table 4-16: Trust a
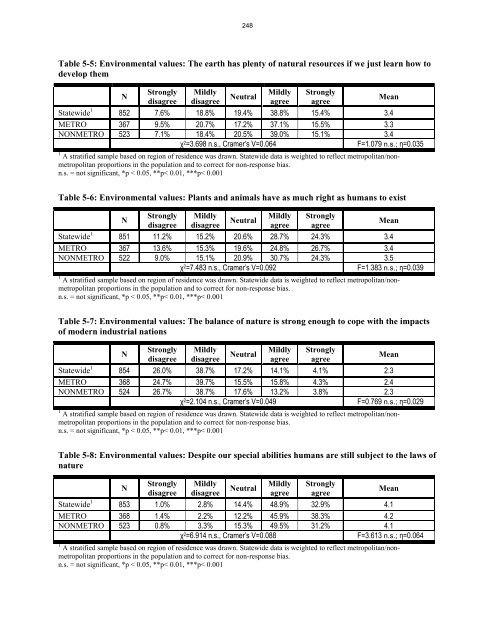
- Page 254 and 255: Section 5: Environmental Values Env
- Page 258 and 259: Table 5-13: Environmental values: H
- Page 260 and 261: Table 5-19: I am concerned about en
- Page 262 and 263: References Cited Dillman, D. (2000)
- Page 264 and 265: Appendix A: Survey Instrument Small
- Page 266 and 267: Q4. How many boxes of shells (25 to
- Page 268 and 269: Nationwide there is concern about t
- Page 270 and 271: Q16. Next we would like to know how
- Page 272 and 273: Q18. Next we would like to know how
- Page 274 and 275: Q 21. People are generally concerne
- Page 276 and 277: 268 Small Game Hunter Lead Shot Com
- Page 278 and 279: Acknowledgements 270 This study was
- Page 280 and 281: Nationwide there is concern about t
- Page 282 and 283: Figure S-2: Perceived narrative qua
- Page 284 and 285: Figure S-5: Agreement with message
- Page 286 and 287: Figure S-9: Importance of self-dire
- Page 288 and 289: Conclusions 280 Our results suggest
- Page 290 and 291: 282 Small Game Hunter Lead Shot Com
- Page 292 and 293: Acknowledgements 284 This study was
- Page 294 and 295: Introduction Study Purpose and Obje
- Page 296 and 297: Games-Howell post-hoc test over oth
- Page 298 and 299: Section 1: Message Quality Responde
- Page 300 and 301: Section 1: Message Quality Table 1-
- Page 302 and 303: Section 1: Message Quality Figure 1
- Page 304 and 305: Section 2: Factual Versus Narrative
- Page 306 and 307:
Section 2: Factual Versus Narrative
- Page 308 and 309:
Section 3: Message Involvement Tabl
- Page 310 and 311:
Section 3: Message Involvement Tabl
- Page 312 and 313:
Section 4: Message Evaluation Table
- Page 314 and 315:
Section 4: Message Evaluation Table
- Page 316 and 317:
Section 5: Agreement With Message R
- Page 318 and 319:
Section 5: Agreement With Message R
- Page 320 and 321:
Section 5: Agreement With Message R
- Page 322 and 323:
Section 5: Agreement With Message R
- Page 324 and 325:
Section 5: Agreement With Message R
- Page 326 and 327:
Section 6: Values Table 6-1: How im
- Page 328 and 329:
Section 6: Values Table 6-5: How im
- Page 330 and 331:
Section 6: Values Table 6-9: How im
- Page 332 and 333:
324 Section 7: Background Informati
- Page 334 and 335:
Section 7: Background Information T
- Page 336 and 337:
Section 8: Model Development Based
- Page 338 and 339:
References Cited Areni, C. S. (2003
- Page 340 and 341:
Appendix C: Treatment Messages Cont
- Page 342 and 343:
Appendix C: Treatment Messages Trea
- Page 344 and 345:
Appendix C: Treatment Messages 336
- Page 346 and 347:
Appendix D: Survey Instrument Q1. P
- Page 348 and 349:
Appendix D: Survey Instrument Q5. W
- Page 350 and 351:
Appendix D: Survey Instrument BACKG
- Page 352 and 353:
Appendix D: Survey Instrument Thank
- Page 354 and 355:
MOOSE POPULATION DYNAMICS IN NORTHE
- Page 356 and 357:
aerial survey. Manuscripts discussi
- Page 358 and 359:
The complete HCP describes in some
- Page 360 and 361:
Table 1. Incidents of Canada lynx t
- Page 364 and 365:
ECOLOGY AND POPULATION DYNAMICS OF
- Page 366 and 367:
Trapping We trapped in the NW study
- Page 368 and 369:
Table 1. Causes of mortality of rad
- Page 370 and 371:
Table 5. Black bear cubs examined i
- Page 372 and 373:
Bone growth and weight gain were de
- Page 374 and 375:
FISHER AND MARTEN DEMOGRAPHY AND HA
- Page 376 and 377:
(fisher: 30 mg/kg ketamine and 3 mg
- Page 378 and 379:
We also deployed a Reconyx PC85 rem
- Page 380 and 381:
372 Olson, C. 2006. 2005 small mamm
- Page 382 and 383:
Figure 1. Fisher and marten study a
- Page 384 and 385:
may benefit management programs for
- Page 386 and 387:
378 area that were accessible by pu
- Page 388 and 389:
Table 1. A priori models for explai
- Page 390:
Table 3. Parameter estimates averag
- Page 393 and 394:
Probability of occupancy 1.0 0.8 0.
- Page 395 and 396:
IDENTIFYING PLOTS FOR SURVEYS OF SH
- Page 397 and 398:
ASSESSING THE RELATIONSHIP OF CONIF
- Page 399 and 400:
preliminary descriptions of seasona
- Page 401 and 402:
head/neck position on collar perfor
- Page 403 and 404:
395 White-tailed deer ecology and m
- Page 405 and 406:
Number of missed locations 45 40 35
- Page 407 and 408:
MANAGEMENT-FOCUSED RESEARCH NEEDS O
- Page 409 and 410:
egions ranked forest stand improvem
- Page 411 and 412:
Table 2. Forest management activiti
- Page 413 and 414:
Table 3. Forest management activiti
- Page 415 and 416:
Table 3 continued. 407 Fire break d
- Page 417 and 418:
Appendix 1. Survey of management-fo
- Page 419 and 420:
Percent agreed needs evaluation (%)
- Page 421 and 422:
TABLE OF CONTENTS 413 EXECUTIVE SUM
- Page 423 and 424:
415 remain intact. New biological c
- Page 425 and 426:
1. INTRODUCTION The most comprehens
- Page 427 and 428:
• melting sea ice reduces the Ear
- Page 429 and 430:
• With precipitation concentrated
- Page 431 and 432:
oomers begin to pass their 85 th bi
- Page 433 and 434:
3. EFFECTS OF CLIMATE CHANGE ON LAN
- Page 435 and 436:
Currie (2001) and Hansen et al. (20
- Page 437 and 438:
Prairie Parkland (Figure 1, MNDNR 2
- Page 439 and 440:
undulating plains with deep glacial
- Page 441 and 442:
433 If conditions in the Laurentian
- Page 443 and 444:
435 carbon pool and should not be o
- Page 445 and 446:
Animal species associated with mesi
- Page 447 and 448:
increase the primary productivity o
- Page 449 and 450:
Warmer, drier conditions could excl
- Page 451 and 452:
443 hydroperiods for temporary wetl
- Page 453 and 454:
The Minnesota Department of Natural
- Page 455 and 456:
taken to manage the unavoidable imp
- Page 457 and 458:
• Dedicate 1 new FTE position at
- Page 459 and 460:
contributions to shallow lake eutro
- Page 461 and 462:
Busby, W. H., and W. R. Brecheisen.
- Page 463 and 464:
III to the Fourth Assessment Report
- Page 465 and 466:
MNDNR. 2005b. Field guide to the na
- Page 467 and 468:
Poiani, K. A., W. C. Johnson, and T
- Page 469 and 470:
Westcott, P. C. 2007. U.S. ethanol
- Page 471 and 472:
463 Northern Southern Eastern Weste
- Page 473 and 474:
Scientific Name Common Name LMF Pro
- Page 475 and 476:
Horned grebe Podiceps auritus Louis
- Page 477 and 478:
MINNESOTA’S RING-NECKED DUCK BREE
- Page 479 and 480:
Estimated Pair Density Mean pair de
- Page 481 and 482:
LITERATURE CITED 473 SAS. 1999. SAS
- Page 483 and 484:
Table 2. Sampling rates by Ecologic
- Page 485 and 486:
Table 4. Estimated indicated breedi
- Page 487 and 488:
479
- Page 489 and 490:
# # # # # # # # # # # # # # # # # #
- Page 491 and 492:
MOVEMENTS, SURVIVAL, AND REFUGE USE
- Page 493 and 494:
prior to hunting season were simila
- Page 495 and 496:
Figure 1. Ring-necked duck study ar
- Page 497 and 498:
INFLUENCE OF FISH, AGRICULTURE, AND
- Page 499 and 500:
Mechanisms structuring characterist
- Page 501 and 502:
Chemical Properties and Water Quali
- Page 503 and 504:
Submerged Aquatic Plants Submerged
- Page 505 and 506:
At a broad scale, wetland and shall
- Page 507 and 508:
Table 1. Relative abundance (mean w
- Page 509 and 510:
Number of Fish 35 30 25 20 15 10 5
- Page 511 and 512:
Total # Captured a) 50 40 30 20 10
- Page 513 and 514:
Relative Units 9 8 7 6 5 4 3 2 1 a)
- Page 515 and 516:
THRESHOLDS AND STABILITY OF ALTERNA
- Page 517 and 518:
MANAGEMENT-FOCUSED RESEARCH NEEDS O
- Page 519 and 520:
Table 1. Survey questions for wetla
- Page 521 and 522:
VARIANCE OF STRATIFIED SURVEY ESTIM
- Page 523 and 524:
EXPLORING MIGRATION DATA USING INTE
- Page 525 and 526:
Forest Research Group Publications
- Page 527:
Roy Nielsen, C., and C. K. Nielsen.