- Page 1 and 2:
DClinPsy Portfolio Volume 1 of 3 A
- Page 3 and 4:
Discuss the importance of the thera
- Page 5 and 6:
Psychoanalytically, the focus has b
- Page 7 and 8:
Type 2 refers to joint working and
- Page 9 and 10:
It appears that what links the conc
- Page 11 and 12:
It was concluded that the direct as
- Page 13 and 14:
Importance of Therapeutic Relations
- Page 15 and 16:
The therapist must also be aware of
- Page 17 and 18:
Understanding what constitutes a po
- Page 19 and 20:
References Alexander, L. B. & Lubor
- Page 21 and 22:
Gutfreund, M. J. (1992). A close-up
- Page 23 and 24:
Lambert, M. J. & Bergin, A. E. (199
- Page 25 and 26:
Shin, Sung-Man; Chow, Clifton; Cama
- Page 27 and 28:
Introduction Historically there has
- Page 29 and 30:
Furthermore connections’ in relat
- Page 31 and 32:
A triangular pattern of protection
- Page 33 and 34:
Another issue related to empowering
- Page 35 and 36:
There are many issues that the psyc
- Page 37 and 38:
Furthermore a common tendency in pe
- Page 39 and 40:
Conclusion Although systemic and ps
- Page 41 and 42:
References Banks, R. (2003). Psycho
- Page 43 and 44:
Linington, M. (2002). ‘Whose hand
- Page 45 and 46:
Small Scale Service Related Project
- Page 47 and 48:
• 36% stated that voluntary atten
- Page 49 and 50:
CONTENTS Pages Introduction 50-58 M
- Page 51 and 52:
Individual authors from different p
- Page 53 and 54:
Aim of current project This study w
- Page 55 and 56:
- appointment times given to all at
- Page 57 and 58:
RESULTS Forty professionals took pa
- Page 59 and 60:
The highest rated factor is about t
- Page 61 and 62:
Figure 2 Ratings of importance of e
- Page 63 and 64:
Figure 4 Ratings of importance of e
- Page 65 and 66:
Nursing rated the following five po
- Page 67 and 68:
Question Graph showing views of pro
- Page 69 and 70:
Other comments from Nursing stated
- Page 71 and 72:
However, the comments section invol
- Page 73 and 74:
e audited. Furthermore, it may be u
- Page 75 and 76:
Hodgson, R., Jamal, A., Gayathri, B
- Page 77 and 78:
APPENDICES 77
- Page 79 and 80:
How Multi-disciplinary Staff View W
- Page 81 and 82:
28 Are the patients attending given
- Page 83 and 84:
There should be a named person resp
- Page 85 and 86:
Literature Review Body Image, Disor
- Page 87 and 88:
Prevalence studies across Europe, t
- Page 89 and 90:
For example, the use of appetite su
- Page 91 and 92:
The next part of this review will e
- Page 93 and 94:
Similarly, negative characteristics
- Page 95 and 96:
When body image distress is very lo
- Page 97 and 98:
The role of emotion regulation in t
- Page 99 and 100:
Experiential avoidance is the unwil
- Page 101 and 102:
Ineffective avoidance coping strate
- Page 103 and 104:
References Alexander, L. C., Gratz,
- Page 105 and 106:
Croll, J. Neumark-Stainer, D., stor
- Page 107 and 108:
Hayes, S. C., Masuda, A., Bissett,
- Page 109 and 110:
Keel, P. K., Fulkerson, J. A., and
- Page 111 and 112:
McVey, G.L., Pepler, D., Davis, R.,
- Page 113 and 114:
Piran, N and Cormier, H.C. (2005) t
- Page 115 and 116:
Stice, E., Presnell, K., Shaw, H. a
- Page 117 and 118: APPENDIX I: Search strategy Consult
- Page 119 and 120: Body Image, Disordered Eating and E
- Page 121 and 122: ACT and weight control 139 ACT and
- Page 123 and 124: Demographics of sample and epidemio
- Page 125 and 126: Acknowledgements I would like to th
- Page 127 and 128: Introduction This study reports on
- Page 129 and 130: Consequences of disordered eating P
- Page 131 and 132: Transdiagnostic approach in underst
- Page 133 and 134: Factors implicated in the developme
- Page 135 and 136: Feelings of depression/ high levels
- Page 137 and 138: ACT and processing unpleasant emoti
- Page 139 and 140: Applying ACT theory to weight contr
- Page 141 and 142: Heffner et al, (2002) assert that t
- Page 143 and 144: This phenomenon has encouraged furt
- Page 145 and 146: This project will therefore seek to
- Page 147 and 148: Method Design: A non experimental,
- Page 149 and 150: The researcher remained in the room
- Page 151 and 152: The psychological scales will be de
- Page 153 and 154: The comparison group (n = 770) cons
- Page 155 and 156: 4) Hospital Anxiety and Depression
- Page 157 and 158: The BMI-for-age weight status categ
- Page 159 and 160: Results Section I will provide desc
- Page 161 and 162: The majority were in the middle set
- Page 163 and 164: Table 5: Frequency counts and perce
- Page 165 and 166: As regards experience of an illness
- Page 167: Min-Max Skewness (Std error) 1-23 0
- Page 171 and 172: 3. Moderate EDR compared to High ED
- Page 173 and 174: Comparison of Body Image Acceptance
- Page 175 and 176: Table 12 - Descriptive statistics f
- Page 177 and 178: The boxplot above shows that there
- Page 179 and 180: Hospital Anxiety & Deperssion Scale
- Page 181 and 182: 3. Anxiety-Underweight compared to
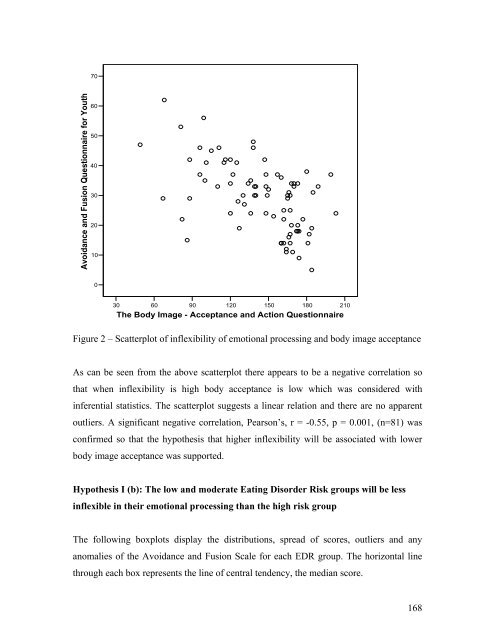
- Page 183 and 184: As can be seen from the above scatt
- Page 185 and 186: Hospital Anxiety & Deperssion Scale
- Page 187 and 188: Comparison Mean difference (SE) Z p
- Page 189 and 190: Section III - Further contributing
- Page 191 and 192: Due to the small sample size in the
- Page 193 and 194: Eating Disorder risk categories Tot
- Page 195 and 196: 25 (28%) out of the 88 participants
- Page 197 and 198: % within Body mass index USA 35.7%
- Page 199 and 200: Table 33: Results of the logistic r
- Page 201 and 202: Moreover, 13% of those aged 12-14 y
- Page 203 and 204: The clinical variables of anxiety a
- Page 205 and 206: Summary of additional findings The
- Page 207 and 208: Low self esteem involves an uncondi
- Page 209 and 210: This study has supported the relati
- Page 211 and 212: Co-morbidity with other psychopatho
- Page 213 and 214: After insertion, if the fingers pul
- Page 215 and 216: This is consistent with the asserti
- Page 217 and 218: The sample size was not adequate fo
- Page 219 and 220:
Conclusion This study found that in
- Page 221 and 222:
Catalano, R. F., Hawkins, J. D., Be
- Page 223 and 224:
Greco, L. A., Blomquist, K. K., Acr
- Page 225 and 226:
HADS, and the influence of age, gen
- Page 227 and 228:
Mykletun, A., Stordal, E. & Dahl, A
- Page 229 and 230:
Smolak, L., Levine, M. P., & Strieg
- Page 231:
Willcox, M. & Sattler, D. N. (1996)
- Page 237 and 238:
Appendix 3 Body Image Acceptance an
- Page 239 and 240:
Appendix 4 Hospital Anxiety and Dep
- Page 241 and 242:
Appendix 5 Background information D
- Page 243 and 244:
Appendix 6 Information sheet for pa
- Page 245 and 246:
If after reading this information s
- Page 247 and 248:
Dear Sir/Madam, U H Doctor of Clini
- Page 249 and 250:
U H CONSENT FORM Title of Project:
- Page 251 and 252:
CERTIFICATE OF ACHEIVEMENT This is
- Page 253 and 254:
Debriefing sheet Title of project:
- Page 255 and 256:
Appendix 10 Ethics approval Form SC
- Page 257 and 258:
Appendix 12 Boxplots and Descriptiv
- Page 259 and 260:
Appendix 13 Box plot and Descriptiv
- Page 261 and 262:
Journal-Ready Copy Helen Eracleous
- Page 263 and 264:
Abstract Objective: The study inves
- Page 265 and 266:
Taking such a perspective may also
- Page 267 and 268:
ACT suggests that inflexibility (i.
- Page 269 and 270:
The EDI has been the measure of cho
- Page 271 and 272:
Additional research questions were
- Page 273 and 274:
Hypotheses III Inflexibility was po
- Page 275 and 276:
A potential explanation may be that
- Page 277 and 278:
The last two are choosing life dire
- Page 279 and 280:
Clinical implications Due to the cr
- Page 281 and 282:
Conclusion The hypotheses investiga
- Page 283 and 284:
Greco, L. A., Lambert, W., & Baer,
- Page 285:
Smolak, L., Levine, M. P., and Stri