Market Gaps on Access to Finance - Bank of Valletta
Market Gaps on Access to Finance - Bank of Valletta
Market Gaps on Access to Finance - Bank of Valletta

You also want an ePaper? Increase the reach of your titles
YUMPU automatically turns print PDFs into web optimized ePapers that Google loves.
Malta Business Bureau – <str<strong>on</strong>g>Market</str<strong>on</strong>g> gaps in access <strong>to</strong> finance<br />
April 2013<br />
5. Survey results<br />
This secti<strong>on</strong> c<strong>on</strong>tains an analysis <strong>of</strong> the resp<strong>on</strong>ses obtained from the SME survey. Where applicable,<br />
the results shown hereunder include an analysis <strong>of</strong> the results by size, industry sec<strong>to</strong>r and stage in<br />
the firm’s lifecycle. The full tables for each questi<strong>on</strong>, including analysis by size, sec<strong>to</strong>r and lifecycle<br />
stage, are provided in Appendix C. Rounding up was used when presenting all percentage figures.<br />
5.1 Resp<strong>on</strong>dent demographics<br />
This secti<strong>on</strong> shows the resp<strong>on</strong>dents’ characteristics in terms <strong>of</strong> firm size, industry, and stage in the<br />
lifecycle.<br />
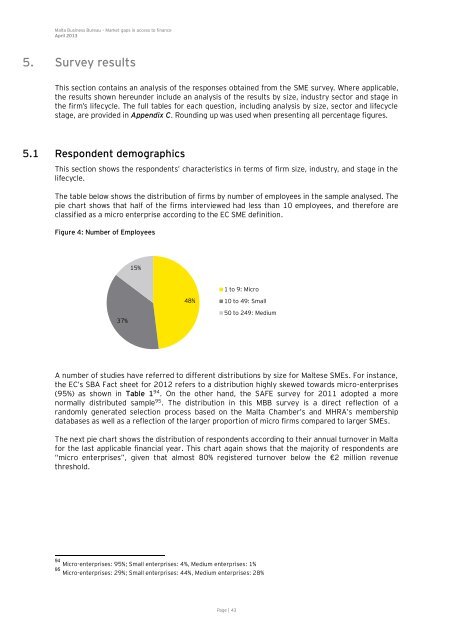
The table below shows the distributi<strong>on</strong> <strong>of</strong> firms by number <strong>of</strong> employees in the sample analysed. The<br />
pie chart shows that half <strong>of</strong> the firms interviewed had less than 10 employees, and therefore are<br />
classified as a micro enterprise according <strong>to</strong> the EC SME definiti<strong>on</strong>.<br />
Figure 4: Number <strong>of</strong> Employees<br />
37%<br />
15%<br />
48%<br />
1 <strong>to</strong> 9: Micro<br />
10 <strong>to</strong> 49: Small<br />
50 <strong>to</strong> 249: Medium<br />
A number <strong>of</strong> studies have referred <strong>to</strong> different distributi<strong>on</strong>s by size for Maltese SMEs. For instance,<br />
the EC’s SBA Fact sheet for 2012 refers <strong>to</strong> a distributi<strong>on</strong> highly skewed <strong>to</strong>wards micro-enterprises<br />
(95%) as shown in Table 1 94 . On the other hand, the SAFE survey for 2011 adopted a more<br />
normally distributed sample 95 . The distributi<strong>on</strong> in this MBB survey is a direct reflecti<strong>on</strong> <strong>of</strong> a<br />
randomly generated selecti<strong>on</strong> process based <strong>on</strong> the Malta Chamber’s and MHRA’s membership<br />
databases as well as a reflecti<strong>on</strong> <strong>of</strong> the larger proporti<strong>on</strong> <strong>of</strong> micro firms compared <strong>to</strong> larger SMEs.<br />
The next pie chart shows the distributi<strong>on</strong> <strong>of</strong> resp<strong>on</strong>dents according <strong>to</strong> their annual turnover in Malta<br />
for the last applicable financial year. This chart again shows that the majority <strong>of</strong> resp<strong>on</strong>dents are<br />
“micro enterprises”, given that almost 80% registered turnover below the €2 milli<strong>on</strong> revenue<br />
threshold.<br />
94 Micro-enterprises: 95%; Small enterprises: 4%, Medium enterprises: 1%<br />
95 Micro-enterprises: 29%; Small enterprises: 44%, Medium enterprises: 28%<br />
Page | 43