Market Gaps on Access to Finance - Bank of Valletta
Market Gaps on Access to Finance - Bank of Valletta
Market Gaps on Access to Finance - Bank of Valletta

You also want an ePaper? Increase the reach of your titles
YUMPU automatically turns print PDFs into web optimized ePapers that Google loves.
Malta Business Bureau – <str<strong>on</strong>g>Market</str<strong>on</strong>g> gaps in access <strong>to</strong> finance<br />
April 2013<br />
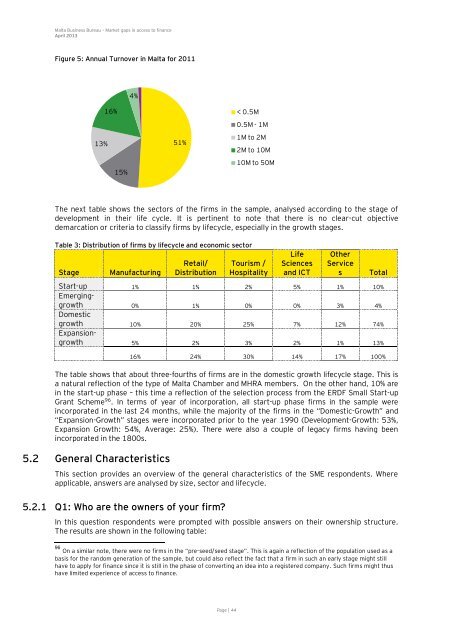
Figure 5: Annual Turnover in Malta for 2011<br />
13%<br />
16%<br />
15%<br />
The next table shows the sec<strong>to</strong>rs <strong>of</strong> the firms in the sample, analysed according <strong>to</strong> the stage <strong>of</strong><br />
development in their life cycle. It is pertinent <strong>to</strong> note that there is no clear-cut objective<br />
demarcati<strong>on</strong> or criteria <strong>to</strong> classify firms by lifecycle, especially in the growth stages.<br />
Table 3: Distributi<strong>on</strong> <strong>of</strong> firms by lifecycle and ec<strong>on</strong>omic sec<strong>to</strong>r<br />
Stage Manufacturing<br />
Retail/<br />
Distributi<strong>on</strong><br />
Page | 44<br />
Tourism /<br />
Hospitality<br />
Life<br />
Sciences<br />
and ICT<br />
Other<br />
Service<br />
s Total<br />
Start-up 1% 1% 2% 5% 1% 10%<br />
Emerginggrowth<br />
0% 1% 0% 0% 3% 4%<br />
Domestic<br />
growth 10% 20% 25% 7% 12% 74%<br />
Expansi<strong>on</strong>growth<br />
5% 2% 3% 2% 1% 13%<br />
16% 24% 30% 14% 17% 100%<br />
The table shows that about three-fourths <strong>of</strong> firms are in the domestic growth lifecycle stage. This is<br />
a natural reflecti<strong>on</strong> <strong>of</strong> the type <strong>of</strong> Malta Chamber and MHRA members. On the other hand, 10% are<br />
in the start-up phase – this time a reflecti<strong>on</strong> <strong>of</strong> the selecti<strong>on</strong> process from the ERDF Small Start-up<br />
Grant Scheme 96 . In terms <strong>of</strong> year <strong>of</strong> incorporati<strong>on</strong>, all start-up phase firms in the sample were<br />
incorporated in the last 24 m<strong>on</strong>ths, while the majority <strong>of</strong> the firms in the “Domestic-Growth” and<br />
“Expansi<strong>on</strong>-Growth” stages were incorporated prior <strong>to</strong> the year 1990 (Development-Growth: 53%,<br />
Expansi<strong>on</strong> Growth: 54%, Average: 25%). There were also a couple <strong>of</strong> legacy firms having been<br />
incorporated in the 1800s.<br />
5.2 General Characteristics<br />
51%<br />
This secti<strong>on</strong> provides an overview <strong>of</strong> the general characteristics <strong>of</strong> the SME resp<strong>on</strong>dents. Where<br />
applicable, answers are analysed by size, sec<strong>to</strong>r and lifecycle.<br />
5.2.1 Q1: Who are the owners <strong>of</strong> your firm?<br />
4%<br />
< 0.5M<br />
0.5M - 1M<br />
1M <strong>to</strong> 2M<br />
2M <strong>to</strong> 10M<br />
10M <strong>to</strong> 50M<br />
In this questi<strong>on</strong> resp<strong>on</strong>dents were prompted with possible answers <strong>on</strong> their ownership structure.<br />
The results are shown in the following table:<br />
96 On a similar note, there were no firms in the “pre-seed/seed stage”. This is again a reflecti<strong>on</strong> <strong>of</strong> the populati<strong>on</strong> used as a<br />
basis for the random generati<strong>on</strong> <strong>of</strong> the sample, but could also reflect the fact that a firm in such an early stage might still<br />
have <strong>to</strong> apply for finance since it is still in the phase <strong>of</strong> c<strong>on</strong>verting an idea in<strong>to</strong> a registered company. Such firms might thus<br />
have limited experience <strong>of</strong> access <strong>to</strong> finance.