Market Gaps on Access to Finance - Bank of Valletta
Market Gaps on Access to Finance - Bank of Valletta
Market Gaps on Access to Finance - Bank of Valletta

You also want an ePaper? Increase the reach of your titles
YUMPU automatically turns print PDFs into web optimized ePapers that Google loves.
Malta Business Bureau – <str<strong>on</strong>g>Market</str<strong>on</strong>g> gaps in access <strong>to</strong> finance<br />
April 2013<br />
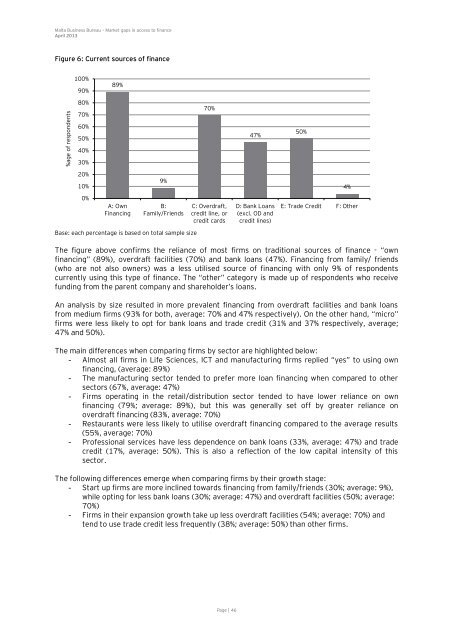
Figure 6: Current sources <strong>of</strong> finance<br />
%age <strong>of</strong> resp<strong>on</strong>dents<br />
100%<br />
90%<br />
80%<br />
70%<br />
60%<br />
50%<br />
40%<br />
30%<br />
20%<br />
10%<br />
0%<br />
89%<br />
A: Own<br />
Financing<br />
9%<br />
B:<br />
Family/Friends<br />
Base: each percentage is based <strong>on</strong> <strong>to</strong>tal sample size<br />
70%<br />
C: Overdraft,<br />
credit line, or<br />
credit cards<br />
The figure above c<strong>on</strong>firms the reliance <strong>of</strong> most firms <strong>on</strong> traditi<strong>on</strong>al sources <strong>of</strong> finance - “own<br />
financing” (89%), overdraft facilities (70%) and bank loans (47%). Financing from family/ friends<br />
(who are not also owners) was a less utilised source <strong>of</strong> financing with <strong>on</strong>ly 9% <strong>of</strong> resp<strong>on</strong>dents<br />
currently using this type <strong>of</strong> finance. The “other” category is made up <strong>of</strong> resp<strong>on</strong>dents who receive<br />
funding from the parent company and shareholder’s loans.<br />
An analysis by size resulted in more prevalent financing from overdraft facilities and bank loans<br />
from medium firms (93% for both, average: 70% and 47% respectively). On the other hand, “micro”<br />
firms were less likely <strong>to</strong> opt for bank loans and trade credit (31% and 37% respectively, average;<br />
47% and 50%).<br />
The main differences when comparing firms by sec<strong>to</strong>r are highlighted below:<br />
- Almost all firms in Life Sciences, ICT and manufacturing firms replied “yes” <strong>to</strong> using own<br />
financing, (average: 89%)<br />
- The manufacturing sec<strong>to</strong>r tended <strong>to</strong> prefer more loan financing when compared <strong>to</strong> other<br />
sec<strong>to</strong>rs (67%, average: 47%)<br />
- Firms operating in the retail/distributi<strong>on</strong> sec<strong>to</strong>r tended <strong>to</strong> have lower reliance <strong>on</strong> own<br />
financing (79%; average: 89%), but this was generally set <strong>of</strong>f by greater reliance <strong>on</strong><br />
overdraft financing (83%, average: 70%)<br />
- Restaurants were less likely <strong>to</strong> utilise overdraft financing compared <strong>to</strong> the average results<br />
(55%, average: 70%)<br />
- Pr<strong>of</strong>essi<strong>on</strong>al services have less dependence <strong>on</strong> bank loans (33%, average: 47%) and trade<br />
credit (17%, average: 50%). This is also a reflecti<strong>on</strong> <strong>of</strong> the low capital intensity <strong>of</strong> this<br />
sec<strong>to</strong>r.<br />
The following differences emerge when comparing firms by their growth stage:<br />
- Start up firms are more inclined <strong>to</strong>wards financing from family/friends (30%; average: 9%),<br />
while opting for less bank loans (30%; average: 47%) and overdraft facilities (50%; average:<br />
70%)<br />
- Firms in their expansi<strong>on</strong> growth take up less overdraft facilities (54%; average: 70%) and<br />
tend <strong>to</strong> use trade credit less frequently (38%; average: 50%) than other firms.<br />
Page | 46<br />
47%<br />
D: <strong>Bank</strong> Loans<br />
(excl. OD and<br />
credit lines)<br />
50%<br />
4%<br />
E: Trade Credit F: Other