Market Gaps on Access to Finance - Bank of Valletta
Market Gaps on Access to Finance - Bank of Valletta
Market Gaps on Access to Finance - Bank of Valletta

Create successful ePaper yourself
Turn your PDF publications into a flip-book with our unique Google optimized e-Paper software.
Malta Business Bureau – <str<strong>on</strong>g>Market</str<strong>on</strong>g> gaps in access <strong>to</strong> finance<br />
April 2013<br />
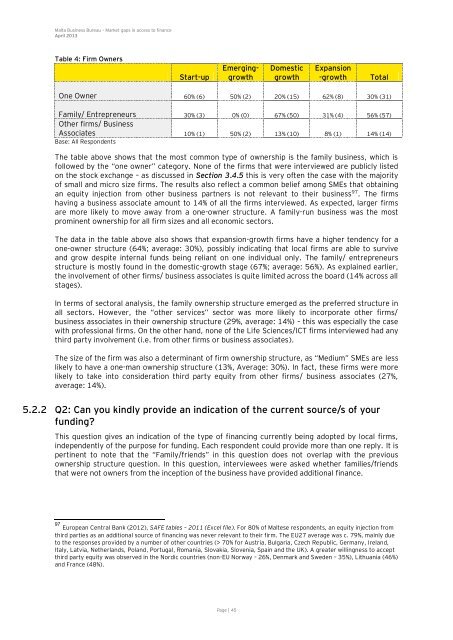
Table 4: Firm Owners<br />
Start-up<br />
Emerginggrowth<br />
Page | 45<br />
Domestic<br />
growth<br />
Expansi<strong>on</strong><br />
-growth Total<br />
One Owner 60% (6) 50% (2) 20% (15) 62% (8) 30% (31)<br />
Family/ Entrepreneurs 30% (3) 0% (0) 67% (50) 31% (4) 56% (57)<br />
Other firms/ Business<br />
Associates 10% (1) 50% (2) 13% (10) 8% (1) 14% (14)<br />
Base: All Resp<strong>on</strong>dents<br />
The table above shows that the most comm<strong>on</strong> type <strong>of</strong> ownership is the family business, which is<br />
followed by the “<strong>on</strong>e owner” category. N<strong>on</strong>e <strong>of</strong> the firms that were interviewed are publicly listed<br />
<strong>on</strong> the s<strong>to</strong>ck exchange – as discussed in Secti<strong>on</strong> 3.4.5 this is very <strong>of</strong>ten the case with the majority<br />
<strong>of</strong> small and micro size firms. The results also reflect a comm<strong>on</strong> belief am<strong>on</strong>g SMEs that obtaining<br />
an equity injecti<strong>on</strong> from other business partners is not relevant <strong>to</strong> their business 97 . The firms<br />
having a business associate amount <strong>to</strong> 14% <strong>of</strong> all the firms interviewed. As expected, larger firms<br />
are more likely <strong>to</strong> move away from a <strong>on</strong>e-owner structure. A family-run business was the most<br />
prominent ownership for all firm sizes and all ec<strong>on</strong>omic sec<strong>to</strong>rs.<br />
The data in the table above also shows that expansi<strong>on</strong>-growth firms have a higher tendency for a<br />
<strong>on</strong>e-owner structure (64%; average: 30%), possibly indicating that local firms are able <strong>to</strong> survive<br />
and grow despite internal funds being reliant <strong>on</strong> <strong>on</strong>e individual <strong>on</strong>ly. The family/ entrepreneurs<br />
structure is mostly found in the domestic-growth stage (67%; average: 56%). As explained earlier,<br />
the involvement <strong>of</strong> other firms/ business associates is quite limited across the board (14% across all<br />
stages).<br />
In terms <strong>of</strong> sec<strong>to</strong>ral analysis, the family ownership structure emerged as the preferred structure in<br />
all sec<strong>to</strong>rs. However, the “other services” sec<strong>to</strong>r was more likely <strong>to</strong> incorporate other firms/<br />
business associates in their ownership structure (29%, average: 14%) – this was especially the case<br />
with pr<strong>of</strong>essi<strong>on</strong>al firms. On the other hand, n<strong>on</strong>e <strong>of</strong> the Life Sciences/ICT firms interviewed had any<br />
third party involvement (i.e. from other firms or business associates).<br />
The size <strong>of</strong> the firm was also a determinant <strong>of</strong> firm ownership structure, as “Medium” SMEs are less<br />
likely <strong>to</strong> have a <strong>on</strong>e-man ownership structure (13%, Average: 30%). In fact, these firms were more<br />
likely <strong>to</strong> take in<strong>to</strong> c<strong>on</strong>siderati<strong>on</strong> third party equity from other firms/ business associates (27%,<br />
average: 14%).<br />
5.2.2 Q2: Can you kindly provide an indicati<strong>on</strong> <strong>of</strong> the current source/s <strong>of</strong> your<br />
funding?<br />
This questi<strong>on</strong> gives an indicati<strong>on</strong> <strong>of</strong> the type <strong>of</strong> financing currently being adopted by local firms,<br />
independently <strong>of</strong> the purpose for funding. Each resp<strong>on</strong>dent could provide more than <strong>on</strong>e reply. It is<br />
pertinent <strong>to</strong> note that the “Family/friends” in this questi<strong>on</strong> does not overlap with the previous<br />
ownership structure questi<strong>on</strong>. In this questi<strong>on</strong>, interviewees were asked whether families/friends<br />
that were not owners from the incepti<strong>on</strong> <strong>of</strong> the business have provided additi<strong>on</strong>al finance.<br />
97 European Central <strong>Bank</strong> (2012), SAFE tables – 2011 (Excel file). For 80% <strong>of</strong> Maltese resp<strong>on</strong>dents, an equity injecti<strong>on</strong> from<br />
third parties as an additi<strong>on</strong>al source <strong>of</strong> financing was never relevant <strong>to</strong> their firm. The EU27 average was c. 79%, mainly due<br />
<strong>to</strong> the resp<strong>on</strong>ses provided by a number <strong>of</strong> other countries (> 70% for Austria, Bulgaria, Czech Republic, Germany, Ireland,<br />
Italy, Latvia, Netherlands, Poland, Portugal, Romania, Slovakia, Slovenia, Spain and the UK). A greater willingness <strong>to</strong> accept<br />
third party equity was observed in the Nordic countries (n<strong>on</strong>-EU Norway – 26%, Denmark and Sweden – 35%), Lithuania (46%)<br />
and France (48%).