Market Gaps on Access to Finance - Bank of Valletta
Market Gaps on Access to Finance - Bank of Valletta
Market Gaps on Access to Finance - Bank of Valletta

You also want an ePaper? Increase the reach of your titles
YUMPU automatically turns print PDFs into web optimized ePapers that Google loves.
Malta Business Bureau – <str<strong>on</strong>g>Market</str<strong>on</strong>g> gaps in access <strong>to</strong> finance<br />
April 2013<br />
questi<strong>on</strong>. In additi<strong>on</strong>, 31% <strong>of</strong> firms who have used bank financing in the past had not obtained a loan<br />
within the indicated timeframe, while another 35% had never obtained a loan.<br />
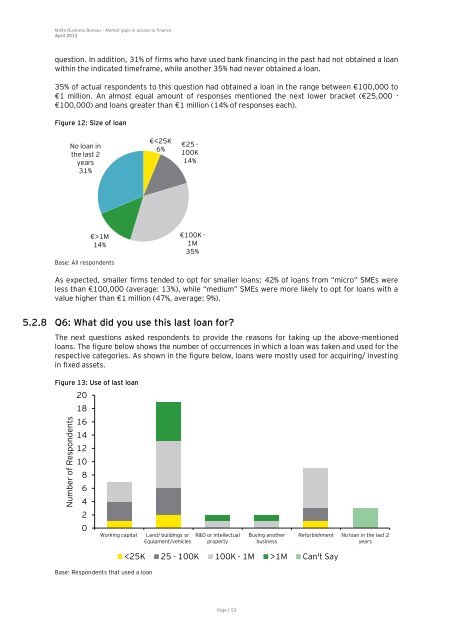
35% <strong>of</strong> actual resp<strong>on</strong>dents <strong>to</strong> this questi<strong>on</strong> had obtained a loan in the range between €100,000 <strong>to</strong><br />
€1 milli<strong>on</strong>. An almost equal amount <strong>of</strong> resp<strong>on</strong>ses menti<strong>on</strong>ed the next lower bracket (€25,000 -<br />
€100,000) and loans greater than €1 milli<strong>on</strong> (14% <strong>of</strong> resp<strong>on</strong>ses each).<br />
Figure 12: Size <strong>of</strong> loan<br />
Base: All resp<strong>on</strong>dents<br />
As expected, smaller firms tended <strong>to</strong> opt for smaller loans; 42% <strong>of</strong> loans from “micro” SMEs were<br />
less than €100,000 (average: 13%), while “medium” SMEs were more likely <strong>to</strong> opt for loans with a<br />
value higher than €1 milli<strong>on</strong> (47%, average: 9%).<br />
5.2.8 Q6: What did you use this last loan for?<br />
The next questi<strong>on</strong>s asked resp<strong>on</strong>dents <strong>to</strong> provide the reas<strong>on</strong>s for taking up the above-menti<strong>on</strong>ed<br />
loans. The figure below shows the number <strong>of</strong> occurrences in which a loan was taken and used for the<br />
respective categories. As shown in the figure below, loans were mostly used for acquiring/ investing<br />
in fixed assets.<br />
Figure 13: Use <strong>of</strong> last loan<br />
Number <strong>of</strong> Resp<strong>on</strong>dents<br />
No loan in<br />
the last 2<br />
years<br />
31%<br />
20<br />
18<br />
16<br />
14<br />
12<br />
10<br />
8<br />
6<br />
4<br />
2<br />
0<br />
€>1M<br />
14%<br />
Base: Resp<strong>on</strong>dents that used a loan<br />
€