Telkom AR front.qxp
Telkom AR front.qxp
Telkom AR front.qxp

Create successful ePaper yourself
Turn your PDF publications into a flip-book with our unique Google optimized e-Paper software.
120<br />
<strong>Telkom</strong> Annual Report 2009<br />
Financial review (continued)<br />
Selling, general and administrative<br />
expenses increased primarily due to the<br />
impairment of the Multi-Links investment in<br />
the 2009 financial year, increased<br />
materials and maintenance expenses and<br />
higher bad debts. Selling, general and<br />
administrative expenses decreased<br />
primarily due to the provision for probable<br />
liabilities in the Telcordia dispute in the<br />
2007 financial year, which were not<br />
increased significantly in the 2008<br />
financial year, and lower marketing<br />
expense, partially offset by the R217 million<br />
impairment of the <strong>Telkom</strong> Media loan in the<br />
2008 financial year – increased materials<br />
and maintenance expenses and higher<br />
bad debts.<br />
Materials and maintenance expenses<br />
include stock write-offs, subcontractor<br />
payments and consumables required to<br />
maintain our network. Materials and<br />
maintenance expenses increased in the<br />
years ended March 31, 2009 and 2008<br />
primarily due to increased operating<br />
maintenance projects as result of an<br />
increase in the number of technologies<br />
employed in the network and higher fuel<br />
costs as a result of the increased price of<br />
fuel. In the 2009 financial year increased<br />
maintenance on the submarine cables as a<br />
result of higher exchange rates also<br />
contributed.<br />
Marketing expenses were relatively flat in<br />
the 2009 financial year. Marketing<br />
expenses decreased in the year ended<br />
March 31, 2008 primarily due to lower<br />
sponsorships and decreased calling plan<br />
advertising during the year.<br />
Bad debt increased in the year ended<br />
March 31, 2009 as more debtors<br />
defaulted on payments as a result of poor<br />
economic conditions in South Africa driven<br />
by higher inflation. Bad debt increased in<br />
the year ended March 31, 2008 due to<br />
provisions for higher international bad<br />
debts in certain countries, including<br />
Nigeria, Gabon and the United Kingdom.<br />
Bad debt as a percentage of revenue was<br />
1.0%, 0.7% and 0.4% in the 2009, 2008<br />
and 2007 financial years, respectively.<br />
Other expenses include obsolete stock,<br />
cost of sales, subsistence and travel and an<br />
offset for bad debts recovered. Other<br />
expenses increased in the year ended<br />
March 31, 2009 primarily due to the<br />
R1,843 million impairment of the Multi-<br />
Links investment, R254 million impairment<br />
of the <strong>Telkom</strong> Media loan and R85 million<br />
impairment of the Africa Online investment<br />
in the 2009 financial year. Other expenses<br />
decreased in the year ended March 31,<br />
2008 primarily due to the provision for<br />
probable liabilities in the Telcordia dispute<br />
in the 2007 financial year, which were not<br />
increased significantly in the 2008 financial<br />
year, partially offset by the R217 million<br />
impairment of the <strong>Telkom</strong> Media loan in the<br />
2008 financial year.<br />
Service fees. Service fees include payments<br />
in respect of the management of our<br />
properties, to TFMC, a facilities and<br />
property management company, consultants<br />
and security. Consultants comprise fees<br />
paid to collection agents and to providers<br />
of other professional services and external<br />
auditors. Security refers to services to<br />
safeguard the network and contracts to<br />
ensure a safe work environment, such as<br />
guard services.<br />
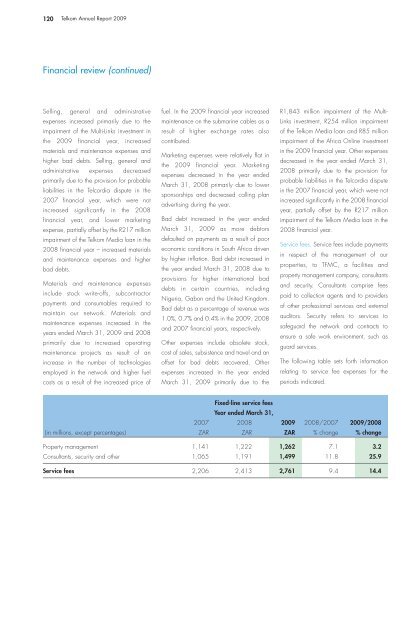
The following table sets forth information<br />
relating to service fee expenses for the<br />
periods indicated.<br />
2007<br />
Fixed-line service fees<br />
Year ended March 31,<br />
2008 2009 2008/2007 2009/2008<br />
(in millions, except percentages) Z<strong>AR</strong> Z<strong>AR</strong> Z<strong>AR</strong> % change % change<br />
Property management 1,141 1,222 1,262 7.1 3.2<br />
Consultants, security and other 1,065 1,191 1,499 11.8 25.9<br />
Service fees 2,206 2,413 2,761 9.4 14.4