Telkom AR front.qxp
Telkom AR front.qxp
Telkom AR front.qxp

You also want an ePaper? Increase the reach of your titles
YUMPU automatically turns print PDFs into web optimized ePapers that Google loves.
commercial paper bills, as well as entering<br />
into call and term loans of R5,600 million<br />
to fund the redemption of the TK01 bond<br />
and other cash flows from investing<br />
activities, including R1.6 billion of<br />
additional bank borrowings and interest<br />
bearing debt by Vodacom. This was<br />
partially offset by the maturing commercial<br />
paper debt of R15,773 million nominal<br />
value, the repayment of the TK01 bond<br />
with a nominal value of R4,680 million<br />
and R1,647 million paid for the<br />
repurchase of shares during the year.<br />
In the 2007 financial year, loans and finance<br />
leases repaid and shares repurchased and<br />
cancelled exceeded loans raised and the<br />
decrease in net financial assets, by<br />
R2,920 million. In the 2007 financial year<br />
cash flows used in financing activities<br />
increased primarily due to the lower sale of<br />
repurchase agreements and derivative<br />
instruments that were sold in the 2006<br />
financial year to fund dividends and tax<br />
payments. On October 31, 2006, we<br />
repaid the TL06 local bond having a nominal<br />
value of R2,100 million and during the<br />
2007 financial year, we repaid<br />
R3,731 million in nominal value of<br />
commercial paper bill debt. Commercial<br />
paper bills having a nominal value of<br />
R4,651 million were issued in the 2007<br />
financial year.<br />
Working capital<br />
We had negative consolidated working<br />
capital from continuing operations of<br />
approximately R6.2 billion as of March 31,<br />
2009, we had negative consolidated<br />
working capital from total operations of<br />
approximately R9.3 billion as of March 31,<br />
2008 and approximately R8.2 billion as of<br />
March 31, 2007. Negative working<br />
capital arises when current liabilities are<br />
greater than current assets. The increase in<br />
the Company’s negative working capital in<br />
the 2009 financial year was mainly as a<br />
result of an increase in interest bearing debt<br />
payable, partially offset by higher financial<br />
assets in the form of repurchase agreements.<br />
The increase in negative working capital in<br />
the 2008 financial year was primarily due<br />
to an increase in the current portion of<br />
interest bearing debt due to the repayment<br />
of the TK01 local bond with short-term debt<br />
that was subsequently partially refinanced<br />
<strong>Telkom</strong> Annual Report 2009 131<br />
by the TL12 and TL15 bonds after the year<br />
end, a reduction in cash available due to<br />
acquisition activities, increased capital<br />
expenditure, increased dividends paid,<br />
shares repurchased and an increase in trade<br />
and other payables. <strong>Telkom</strong> is of the opinion<br />
that the <strong>Telkom</strong> Group’s cash flows from<br />
operations, together with proceeds from the<br />
Vodacom transaction and the proceeds from<br />
liquidity available under credit facilities and<br />
in the capital markets, will be sufficient to<br />
meet the <strong>Telkom</strong> Group’s present working<br />
capital requirements for the 12 months<br />
following the date of this annual report. We<br />
intend to fund current liabilities through a<br />
combination of operating cash flows and<br />
with new borrowings and borrowings<br />
available under existing credit facilities. We<br />
had R6.2 billion available under existing<br />
credit facilities as of March 31, 2009.<br />
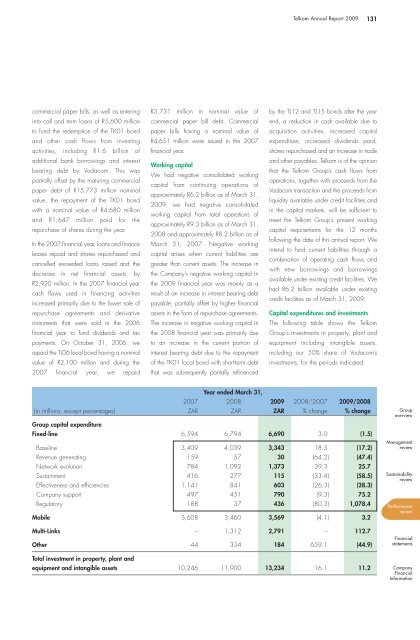
Capital expenditures and investments<br />
The following table shows the <strong>Telkom</strong><br />
Group’s investments in property, plant and<br />
equipment including intangible assets,<br />
including our 50% share of Vodacom’s<br />
investments, for the periods indicated.<br />
2007<br />
Year ended March 31,<br />
2008 2009 2008/2007 2009/2008<br />
(in millions, except percentages) Z<strong>AR</strong> Z<strong>AR</strong> Z<strong>AR</strong> % change % change<br />
Group capital expenditure<br />
Fixed-line 6,594 6,794 6,690 3.0 (1.5)<br />
Baseline 3,409 4,039 3,343 18.5 (17.2)<br />
Revenue generating 159 57 30 (64.2) (47.4)<br />
Network evolution 784 1,092 1,373 39.3 25.7<br />
Sustainment 416 277 115 (33.4) (58.5)<br />
Effectiveness and efficiencies 1,141 841 603 (26.3) (28.3)<br />
Company support 497 451 790 (9.3) 75.2<br />
Regulatory 188 37 436 (80.3) 1,078.4<br />
Mobile 3,608 3,460 3,569 (4.1) 3.2<br />
Multi-Links – 1,312 2,791 – 112.7<br />
Other 44 334 184 659.1 (44.9)<br />
Total investment in property, plant and<br />
equipment and intangible assets 10,246 11,900 13,234 16.1 11.2<br />
Group<br />
overview<br />
Management<br />
review<br />
Sustainability<br />
review<br />
Performance<br />
review<br />
Financial<br />
statements<br />
Company<br />
Financial<br />
Information