- Page 1 and 2:
We are... one of Africa’s largest
- Page 3 and 4:
Telkom shareholding as at March 31,
- Page 5 and 6:
Grow profitable revenue through wir
- Page 7 and 8:
600 500 400 300 200 100 0 07 08 09
- Page 9 and 10:
The telecommunications industry Con
- Page 11 and 12:
egulation that stipulated standard
- Page 13 and 14:
a - Euros a - Euros a - Euros 0.25
- Page 15 and 16:
ated management team with experienc
- Page 17 and 18:
The regulatory environment The regu
- Page 19 and 20:
On target for 2010 Telkom Annual Re
- Page 21 and 22:
Online impairments, the fixed-line
- Page 23 and 24:
• Remodelling - reaching for new
- Page 25 and 26:
in this annual report has been upda
- Page 27 and 28:
Capital expenditure for the Group i
- Page 29 and 30:
More than100 years of combined tele
- Page 31 and 32:
Management team Telkom Annual Repor
- Page 33 and 34:
Telkom Annual Report 2009 33 Age at
- Page 35 and 36:
uild a partnership with communities
- Page 37 and 38:
Customers: Through our Customer Cen
- Page 39 and 40:
• Interfacing with the media Whil
- Page 41 and 42:
Partnering with Human Resources Gro
- Page 43 and 44:
The members’ resignations and app
- Page 45 and 46:
Share dealings In line with JSE Lis
- Page 47 and 48:
NYSE rules Telkom practice Telkom A
- Page 49 and 50:
the codes of conduct and ethics tha
- Page 51 and 52:
Telkom Annual Report 2009 51 Enterp
- Page 53 and 54:
provider, we practice a risk manage
- Page 55 and 56:
egulate the business of dealers in
- Page 57 and 58:
addressing a number of significant
- Page 59 and 60:
There was a major Over the past dec
- Page 61 and 62:
payment policy that facilitates the
- Page 63 and 64:
Headcount movement Compensation and
- Page 65 and 66:
• Accelerated development of wome
- Page 67 and 68:
14,500 union members participated i
- Page 69 and 70:
were admitted to the university in
- Page 71 and 72:
ole in exposing students to the rea
- Page 73 and 74:
Sick leave indices • We saved R2
- Page 75 and 76:
These will be augmented by another
- Page 77 and 78:
Some of the key deliverables are:
- Page 79 and 80:
Fittingly, the initiative was launc
- Page 81 and 82:
Sponsorships Sponsorships continue
- Page 83 and 84:
Item Comment and reference Governan
- Page 85 and 86:
espond to competitive challenges Pe
- Page 87 and 88:
Operational review History and deve
- Page 89 and 90:
service. All costs including instal
- Page 91 and 92:
Traffic was adversely affected in b
- Page 93 and 94:
Telkom’s focus on bringing new in
- Page 95 and 96:
esponse of the CDMA operators to ou
- Page 97 and 98:
MWEB Africa On April 21, 2009, we a
- Page 99 and 100:
VPN model that allows other service
- Page 101 and 102:
services and also to support Telkom
- Page 103 and 104:
Telkom’s fixed-line voice busines
- Page 105 and 106:
Results of operations The Telkom Gr
- Page 107 and 108:
EBITDA can be reconciled to operati
- Page 109 and 110:
Telkom Annual Report 2009 109 Finan
- Page 111 and 112:
Fixed-line operating revenue increa
- Page 113 and 114:
The following table sets forth info
- Page 115 and 116:
Interconnection revenue Year ended
- Page 117 and 118:
Telkom Annual Report 2009 117 Fixed
- Page 119 and 120:
Fixed-line payments to other networ
- Page 121 and 122:
Service fees increased in the year
- Page 123 and 124:
Vodacom’s operating revenue from
- Page 125 and 126:
our fixed-line business, which were
- Page 127 and 128:
Vodacom’s selling, general and ad
- Page 129 and 130:
The increase in other operating rev
- Page 131 and 132:
commercial paper bills, as well as
- Page 133 and 134:
The following table sets forth our
- Page 135:
challeng Consolidated financial sta
- Page 138 and 139:
138 Telkom Annual Report 2009
- Page 140 and 141:
140 Telkom Annual Report 2009 Direc
- Page 142 and 143:
142 Telkom Annual Report 2009 Conso
- Page 144 and 145:
144 Telkom Annual Report 2009 Conso
- Page 146 and 147:
146 Telkom Annual Report 2009 Notes
- Page 148 and 149:
148 Telkom Annual Report 2009 Notes
- Page 150 and 151:
150 Telkom Annual Report 2009 Notes
- Page 152 and 153:
152 Telkom Annual Report 2009 Notes
- Page 154 and 155:
154 Telkom Annual Report 2009 Notes
- Page 156 and 157:
156 Telkom Annual Report 2009 Notes
- Page 158 and 159:
158 Telkom Annual Report 2009 Notes
- Page 160 and 161:
160 Telkom Annual Report 2009 Notes
- Page 162 and 163:
162 Telkom Annual Report 2009 Notes
- Page 164 and 165:
164 Telkom Annual Report 2009 Notes
- Page 166 and 167:
166 Telkom Annual Report 2009 Notes
- Page 168 and 169:
168 Telkom Annual Report 2009 Notes
- Page 170 and 171:
170 Telkom Annual Report 2009 Notes
- Page 172 and 173:
172 Telkom Annual Report 2009 Notes
- Page 174 and 175:
174 Telkom Annual Report 2009 Notes
- Page 176 and 177:
176 Telkom Annual Report 2009 Notes
- Page 178 and 179:
178 Telkom Annual Report 2009 Notes
- Page 180 and 181:
180 Telkom Annual Report 2009 Notes
- Page 182 and 183:
182 Telkom Annual Report 2009 Notes
- Page 184 and 185:
184 Telkom Annual Report 2009 Notes
- Page 186 and 187:
186 Telkom Annual Report 2009 Notes
- Page 188 and 189:
188 Telkom Annual Report 2009 Notes
- Page 190 and 191:
190 Telkom Annual Report 2009 Notes
- Page 192 and 193:
192 Telkom Annual Report 2009 Notes
- Page 194 and 195:
194 Telkom Annual Report 2009 Notes
- Page 196 and 197:
196 Telkom Annual Report 2009 Notes
- Page 198 and 199:
198 Telkom Annual Report 2009 Notes
- Page 200 and 201:
200 Telkom Annual Report 2009 Notes
- Page 202 and 203:
202 Telkom Annual Report 2009 Notes
- Page 204 and 205:
204 Telkom Annual Report 2009 Notes
- Page 206 and 207:
206 Telkom Annual Report 2009 Notes
- Page 208 and 209:
208 Telkom Annual Report 2009 Notes
- Page 210 and 211:
210 Telkom Annual Report 2009 Notes
- Page 212 and 213:
212 Telkom Annual Report 2009 Notes
- Page 214 and 215:
214 Telkom Annual Report 2009 Notes
- Page 216 and 217:
216 Telkom Annual Report 2009 Notes
- Page 218 and 219:
218 Telkom Annual Report 2009 Notes
- Page 220 and 221:
220 Telkom Annual Report 2009 Notes
- Page 222 and 223:
222 Telkom Annual Report 2009 Notes
- Page 224 and 225: 224 Telkom Annual Report 2009 Notes
- Page 226 and 227: 226 Telkom Annual Report 2009 Notes
- Page 228 and 229: 228 Telkom Annual Report 2009 Notes
- Page 230 and 231: 230 Telkom Annual Report 2009 Notes
- Page 232 and 233: 232 Telkom Annual Report 2009 Notes
- Page 234 and 235: 234 Telkom Annual Report 2009 Notes
- Page 236 and 237: 236 Telkom Annual Report 2009 Notes
- Page 238 and 239: 238 Telkom Annual Report 2009 Notes
- Page 240 and 241: 240 Telkom Annual Report 2009 Notes
- Page 242 and 243: 242 Telkom Annual Report 2009 Notes
- Page 244 and 245: 244 Telkom Annual Report 2009 Notes
- Page 246 and 247: 246 Telkom Annual Report 2009 Notes
- Page 248 and 249: 248 Telkom Annual Report 2009 Notes
- Page 250 and 251: 250 Telkom Annual Report 2009 Compa
- Page 252 and 253: 252 Telkom Annual Report 2009 Compa
- Page 254 and 255: 254 Telkom Annual Report 2009 Notes
- Page 256 and 257: 256 Telkom Annual Report 2009 Notes
- Page 258 and 259: 258 Telkom Annual Report 2009 Notes
- Page 260 and 261: 260 Telkom Annual Report 2009 Notes
- Page 262 and 263: 262 Telkom Annual Report 2009 Notes
- Page 264 and 265: 264 Telkom Annual Report 2009 Notes
- Page 266 and 267: 266 Telkom Annual Report 2009 Notes
- Page 268 and 269: 268 Telkom Annual Report 2009 Notes
- Page 270 and 271: 270 Telkom Annual Report 2009 Notes
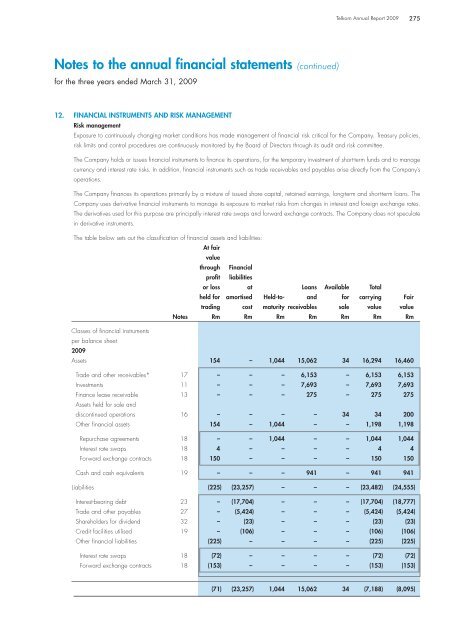
- Page 272 and 273: 272 Telkom Annual Report 2009 Notes
- Page 276 and 277: 276 Telkom Annual Report 2009 Notes
- Page 278 and 279: 278 Telkom Annual Report 2009 Notes
- Page 280 and 281: 280 Telkom Annual Report 2009 Notes
- Page 282 and 283: 282 Telkom Annual Report 2009 Notes
- Page 284 and 285: 284 Telkom Annual Report 2009 Notes
- Page 286 and 287: 286 Telkom Annual Report 2009 Notes
- Page 288 and 289: 288 Telkom Annual Report 2009 Notes
- Page 290 and 291: 290 Telkom Annual Report 2009 Notes
- Page 292 and 293: 292 Telkom Annual Report 2009 Notes
- Page 294 and 295: 294 Telkom Annual Report 2009 Notes
- Page 296 and 297: 296 Telkom Annual Report 2009 Notes
- Page 298 and 299: 298 Telkom Annual Report 2009 Notes
- Page 300 and 301: 300 Telkom Annual Report 2009 Notes
- Page 302 and 303: 302 Telkom Annual Report 2009 Notes
- Page 304 and 305: 304 Telkom Annual Report 2009 Notes
- Page 306 and 307: 306 Telkom Annual Report 2009 Notes
- Page 308 and 309: 308 Telkom Annual Report 2009 Notes
- Page 310 and 311: 310 Telkom Annual Report 2009 Notes
- Page 312 and 313: 312 Telkom Annual Report 2009 Notes
- Page 314 and 315: 314 Telkom Annual Report 2009 Notes
- Page 316 and 317: 316 Telkom Annual Report 2009 Notes
- Page 318 and 319: 318 Telkom Annual Report 2009 Notes
- Page 320 and 321: 320 Telkom Annual Report 2009 Notes
- Page 322 and 323: 322 Telkom Annual Report 2009 Notes
- Page 324 and 325:
324 Telkom Annual Report 2009 Notes
- Page 326 and 327:
326 Telkom Annual Report 2009 Notes
- Page 328 and 329:
328 Telkom Annual Report 2009 Notes
- Page 330 and 331:
330 Telkom Annual Report 2009 Notes
- Page 332 and 333:
332 Telkom Annual Report 2009 Notes
- Page 334 and 335:
334 Telkom Annual Report 2009 Notes
- Page 336 and 337:
336 Telkom Annual Report 2009 Notes
- Page 338 and 339:
338 Telkom Annual Report 2009 Share
- Page 340 and 341:
340 Telkom Annual Report 2009 Defin
- Page 342 and 343:
342 Telkom Annual Report 2009 Defin
- Page 344 and 345:
344 Telkom Annual Report 2009 Notic
- Page 346 and 347:
346 VOTING AND PROXIES Ordinary sha
- Page 348:
Notes Telkom Annual Report 2009 1.