Telkom AR front.qxp
Telkom AR front.qxp
Telkom AR front.qxp

You also want an ePaper? Increase the reach of your titles
YUMPU automatically turns print PDFs into web optimized ePapers that Google loves.
128<br />
<strong>Telkom</strong> Annual Report 2009<br />
Financial review (continued)<br />
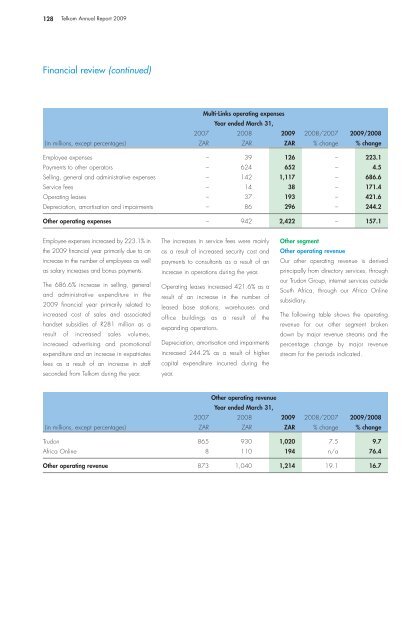
Multi-Links operating expenses<br />
Year ended March 31,<br />
2007 2008 2009 2008/2007 2009/2008<br />
(in millions, except percentages) Z<strong>AR</strong> Z<strong>AR</strong> Z<strong>AR</strong> % change % change<br />
Employee expenses – 39 126 – 223.1<br />
Payments to other operators – 624 652 – 4.5<br />
Selling, general and administrative expenses – 142 1,117 – 686.6<br />
Service fees – 14 38 – 171.4<br />
Operating leases – 37 193 – 421.6<br />
Depreciation, amortisation and impairments – 86 296 – 244.2<br />
Other operating expenses – 942 2,422 – 157.1<br />
Employee expenses increased by 223.1% in<br />
the 2009 financial year primarily due to an<br />
increase in the number of employees as well<br />
as salary increases and bonus payments.<br />
The 686.6% increase in selling, general<br />
and administrative expenditure in the<br />
2009 financial year primarily related to<br />
increased cost of sales and associated<br />
handset subsidies of R281 million as a<br />
result of increased sales volumes,<br />
increased advertising and promotional<br />
expenditure and an increase in expatriates<br />
fees as a result of an increase in staff<br />
seconded from <strong>Telkom</strong> during the year.<br />
The increases in service fees were mainly<br />
as a result of increased security cost and<br />
payments to consultants as a result of an<br />
increase in operations during the year.<br />
Operating leases increased 421.6% as a<br />
result of an increase in the number of<br />
leased base stations, warehouses and<br />
office buildings as a result of the<br />
expanding operations.<br />
Depreciation, amortisation and impairments<br />
increased 244.2% as a result of higher<br />
capital expenditure incurred during the<br />
year.<br />
Other segment<br />
Other operating revenue<br />
Our other operating revenue is derived<br />
principally from directory services, through<br />
our Trudon Group, internet services outside<br />
South Africa, through our Africa Online<br />
subsidiary.<br />
The following table shows the operating<br />
revenue for our other segment broken<br />
down by major revenue streams and the<br />
percentage change by major revenue<br />
stream for the periods indicated.<br />
2007<br />
Other operating revenue<br />
Year ended March 31,<br />
2008 2009 2008/2007 2009/2008<br />
(in millions, except percentages) Z<strong>AR</strong> Z<strong>AR</strong> Z<strong>AR</strong> % change % change<br />
Trudon 865 930 1,020 7.5 9.7<br />
Africa Online 8 110 194 n/a 76.4<br />
Other operating revenue 873 1,040 1,214 19.1 16.7