

People with Disabilities in India: From Commitment to Outcomes
People with Disabilities in India: From Commitment to Outcomes
People with Disabilities in India: From Commitment to Outcomes

Create successful ePaper yourself
Turn your PDF publications into a flip-book with our unique Google optimized e-Paper software.
and early 2000s holds even when MI and MR people are omitted from the 58 th round<br />
sample. Exclud<strong>in</strong>g MI and MR, the employment rate of PWD still stands at 39.6 <strong>in</strong> 2002,<br />
i.e. 3.1 percentage po<strong>in</strong>ts lower than <strong>in</strong> 1991 (and statistically significant). 123 This<br />
compares <strong>to</strong> a fall of only 1.1 percentage po<strong>in</strong>ts for the general population (from 58.6 <strong>to</strong><br />
57.5 percent) between 1993 and 2000. Further research is needed <strong>to</strong> understand the<br />
determ<strong>in</strong>ants of the decl<strong>in</strong>e <strong>in</strong> the employment rate of persons <strong>with</strong> physical and sensory<br />
disabilities between 1991 and 2002, <strong>in</strong> particular <strong>to</strong> assess if it results from changes <strong>in</strong> the<br />
demographic composition of the population <strong>with</strong> disabilities, <strong>in</strong> the <strong>in</strong>creased severity of<br />
disability, or fac<strong>to</strong>rs <strong>in</strong> the labor market and society.<br />
• While trend comparisons are not possible, the low absolute employment rate among<br />
persons <strong>with</strong> disabilities is broadly support by results from the 2001 census. 124<br />
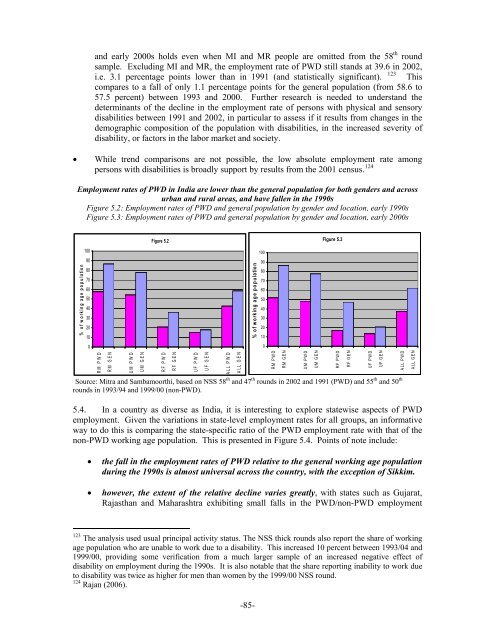
Employment rates of PWD <strong>in</strong> <strong>India</strong> are lower than the general population for both genders and across<br />
urban and rural areas, and have fallen <strong>in</strong> the 1990s<br />
Figure 5.2: Employment rates of PWD and general population by gender and location, early 1990s<br />
Figure 5.3: Employment rates of PWD and general population by gender and location, early 2000s<br />
Figure 5.2<br />
Figure 5.3<br />
% of w ork<strong>in</strong> g ag e p o p ulation<br />
100<br />
90<br />
80<br />
70<br />
60<br />
50<br />
40<br />
30<br />
20<br />
10<br />
0<br />
RM PWD<br />
RM GEN<br />
UM PWD<br />
UM GEN<br />
RF PW D<br />
RF GEN<br />
UF PW D<br />
UF GEN<br />
ALL PW D<br />
ALL GEN<br />
Source: Mitra and Sambamoorthi, based on NSS 58 th and 47 th rounds <strong>in</strong> 2002 and 1991 (PWD) and 55 th and 50 th<br />
rounds <strong>in</strong> 1993/94 and 1999/00 (non-PWD).<br />
5.4. In a country as diverse as <strong>India</strong>, it is <strong>in</strong>terest<strong>in</strong>g <strong>to</strong> explore statewise aspects of PWD<br />
employment. Given the variations <strong>in</strong> state-level employment rates for all groups, an <strong>in</strong>formative<br />
way <strong>to</strong> do this is compar<strong>in</strong>g the state-specific ratio of the PWD employment rate <strong>with</strong> that of the<br />
non-PWD work<strong>in</strong>g age population. This is presented <strong>in</strong> Figure 5.4. Po<strong>in</strong>ts of note <strong>in</strong>clude:<br />
% of work<strong>in</strong>g age population<br />
• the fall <strong>in</strong> the employment rates of PWD relative <strong>to</strong> the general work<strong>in</strong>g age population<br />
dur<strong>in</strong>g the 1990s is almost universal across the country, <strong>with</strong> the exception of Sikkim.<br />
• however, the extent of the relative decl<strong>in</strong>e varies greatly, <strong>with</strong> states such as Gujarat,<br />
Rajasthan and Maharashtra exhibit<strong>in</strong>g small falls <strong>in</strong> the PWD/non-PWD employment<br />
100<br />
90<br />
80<br />
70<br />
60<br />
50<br />
40<br />
30<br />
20<br />
10<br />
0<br />
RM PWD<br />
RM GEN<br />
UM PWD<br />
UM GEN<br />
RF PWD<br />
RF GEN<br />
UF PWD<br />
UF GEN<br />
ALL PWD<br />
ALL GEN<br />
123 The analysis used usual pr<strong>in</strong>cipal activity status. The NSS thick rounds also report the share of work<strong>in</strong>g<br />
age population who are unable <strong>to</strong> work due <strong>to</strong> a disability. This <strong>in</strong>creased 10 percent between 1993/04 and<br />
1999/00, provid<strong>in</strong>g some verification from a much larger sample of an <strong>in</strong>creased negative effect of<br />
disability on employment dur<strong>in</strong>g the 1990s. It is also notable that the share report<strong>in</strong>g <strong>in</strong>ability <strong>to</strong> work due<br />
<strong>to</strong> disability was twice as higher for men than women by the 1999/00 NSS round.<br />
124 Rajan (2006).<br />
-85-


