

People with Disabilities in India: From Commitment to Outcomes
People with Disabilities in India: From Commitment to Outcomes
People with Disabilities in India: From Commitment to Outcomes

You also want an ePaper? Increase the reach of your titles
YUMPU automatically turns print PDFs into web optimized ePapers that Google loves.
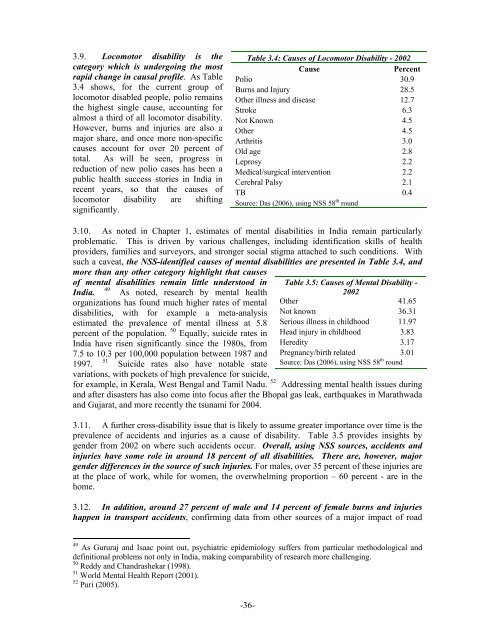
3.9. Locomo<strong>to</strong>r disability is the<br />
category which is undergo<strong>in</strong>g the most<br />
rapid change <strong>in</strong> causal profile. As Table<br />
3.4 shows, for the current group of<br />
locomo<strong>to</strong>r disabled people, polio rema<strong>in</strong>s<br />
the highest s<strong>in</strong>gle cause, account<strong>in</strong>g for<br />
almost a third of all locomo<strong>to</strong>r disability.<br />
However, burns and <strong>in</strong>juries are also a<br />
major share, and once more non-specific<br />
causes account for over 20 percent of<br />
<strong>to</strong>tal. As will be seen, progress <strong>in</strong><br />
reduction of new polio cases has been a<br />
public health success s<strong>to</strong>ries <strong>in</strong> <strong>India</strong> <strong>in</strong><br />
recent years, so that the causes of<br />
locomo<strong>to</strong>r disability are shift<strong>in</strong>g<br />
significantly.<br />
Table 3.4: Causes of Locomo<strong>to</strong>r Disability - 2002<br />
Cause<br />
Percent<br />
Polio 30.9<br />
Burns and Injury 28.5<br />
Other illness and disease 12.7<br />
Stroke 6.3<br />
Not Known 4.5<br />
Other 4.5<br />
Arthritis 3.0<br />
Old age 2.8<br />
Leprosy 2.2<br />
Medical/surgical <strong>in</strong>tervention 2.2<br />
Cerebral Palsy 2.1<br />
TB 0.4<br />
Source: Das (2006), us<strong>in</strong>g NSS 58 th round<br />
3.10. As noted <strong>in</strong> Chapter 1, estimates of mental disabilities <strong>in</strong> <strong>India</strong> rema<strong>in</strong> particularly<br />
problematic. This is driven by various challenges, <strong>in</strong>clud<strong>in</strong>g identification skills of health<br />
providers, families and surveyors, and stronger social stigma attached <strong>to</strong> such conditions. With<br />
such a caveat, the NSS-identified causes of mental disabilities are presented <strong>in</strong> Table 3.4, and<br />
more than any other category highlight that causes<br />
of mental disabilities rema<strong>in</strong> little unders<strong>to</strong>od <strong>in</strong><br />
49<br />
<strong>India</strong>. As noted, research by mental health<br />
organizations has found much higher rates of mental<br />
disabilities, <strong>with</strong> for example a meta-analysis<br />
estimated the prevalence of mental illness at 5.8<br />
percent of the population. 50 Equally, suicide rates <strong>in</strong><br />
<strong>India</strong> have risen significantly s<strong>in</strong>ce the 1980s, from<br />
7.5 <strong>to</strong> 10.3 per 100,000 population between 1987 and<br />
51<br />
Table 3.5: Causes of Mental Disability -<br />
2002<br />
Other 41.65<br />
Not known 36.31<br />
Serious illness <strong>in</strong> childhood 11.97<br />
Head <strong>in</strong>jury <strong>in</strong> childhood 3.83<br />
Heredity 3.17<br />
Pregnancy/birth related 3.01<br />
Source: Das (2006), us<strong>in</strong>g NSS 58 th round<br />
1997. Suicide rates also have notable state<br />
variations, <strong>with</strong> pockets of high prevalence for suicide,<br />
for example, <strong>in</strong> Kerala, West Bengal and Tamil Nadu. 52 Address<strong>in</strong>g mental health issues dur<strong>in</strong>g<br />
and after disasters has also come <strong>in</strong><strong>to</strong> focus after the Bhopal gas leak, earthquakes <strong>in</strong> Marathwada<br />
and Gujarat, and more recently the tsunami for 2004.<br />
3.11. A further cross-disability issue that is likely <strong>to</strong> assume greater importance over time is the<br />
prevalence of accidents and <strong>in</strong>juries as a cause of disability. Table 3.5 provides <strong>in</strong>sights by<br />
gender from 2002 on where such accidents occur. Overall, us<strong>in</strong>g NSS sources, accidents and<br />
<strong>in</strong>juries have some role <strong>in</strong> around 18 percent of all disabilities. There are, however, major<br />
gender differences <strong>in</strong> the source of such <strong>in</strong>juries. For males, over 35 percent of these <strong>in</strong>juries are<br />
at the place of work, while for women, the overwhelm<strong>in</strong>g proportion – 60 percent - are <strong>in</strong> the<br />
home.<br />
3.12. In addition, around 27 percent of male and 14 percent of female burns and <strong>in</strong>juries<br />
happen <strong>in</strong> transport accidents, confirm<strong>in</strong>g data from other sources of a major impact of road<br />
49 As Gururaj and Isaac po<strong>in</strong>t out, psychiatric epidemiology suffers from particular methodological and<br />
def<strong>in</strong>itional problems not only <strong>in</strong> <strong>India</strong>, mak<strong>in</strong>g comparability of research more challeng<strong>in</strong>g.<br />
50 Reddy and Chandrashekar (1998).<br />
51 World Mental Health Report (2001).<br />
52 Puri (2005).<br />
-36-


