

People with Disabilities in India: From Commitment to Outcomes
People with Disabilities in India: From Commitment to Outcomes
People with Disabilities in India: From Commitment to Outcomes

You also want an ePaper? Increase the reach of your titles
YUMPU automatically turns print PDFs into web optimized ePapers that Google loves.
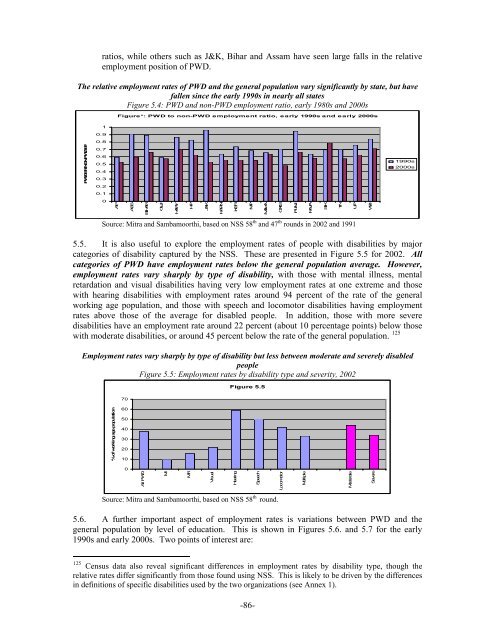
atios, while others such as J&K, Bihar and Assam have seen large falls <strong>in</strong> the relative<br />
employment position of PWD.<br />
The relative employment rates of PWD and the general population vary significantly by state, but have<br />
fallen s<strong>in</strong>ce the early 1990s <strong>in</strong> nearly all states<br />
Figure 5.4: PWD and non-PWD employment ratio, early 1980s and 2000s<br />
Figure*: PWD <strong>to</strong> non-PWD employment ratio, early 1990s and early 2000s<br />
1<br />
0.9<br />
PWDER/NON-PWDER<br />
0.8<br />
0.7<br />
0.6<br />
0.5<br />
0.4<br />
0.3<br />
0.2<br />
0.1<br />
1990s<br />
2000s<br />
0<br />
AP<br />
ASS<br />
BIHAR<br />
GUJ<br />
HARY<br />
HP<br />
J&K<br />
KARN<br />
KER<br />
MP<br />
MAHA<br />
ORIS<br />
PUNJ<br />
RAJA<br />
SIK<br />
TN<br />
UP<br />
WB<br />
Source: Mitra and Sambamoorthi, based on NSS 58 th and 47 th rounds <strong>in</strong> 2002 and 1991<br />
5.5. It is also useful <strong>to</strong> explore the employment rates of people <strong>with</strong> disabilities by major<br />
categories of disability captured by the NSS. These are presented <strong>in</strong> Figure 5.5 for 2002. All<br />
categories of PWD have employment rates below the general population average. However,<br />
employment rates vary sharply by type of disability, <strong>with</strong> those <strong>with</strong> mental illness, mental<br />
retardation and visual disabilities hav<strong>in</strong>g very low employment rates at one extreme and those<br />
<strong>with</strong> hear<strong>in</strong>g disabilities <strong>with</strong> employment rates around 94 percent of the rate of the general<br />
work<strong>in</strong>g age population, and those <strong>with</strong> speech and locomo<strong>to</strong>r disabilities hav<strong>in</strong>g employment<br />
rates above those of the average for disabled people. In addition, those <strong>with</strong> more severe<br />
disabilities have an employment rate around 22 percent (about 10 percentage po<strong>in</strong>ts) below those<br />
<strong>with</strong> moderate disabilities, or around 45 percent below the rate of the general population. 125<br />
Employment rates vary sharply by type of disability but less between moderate and severely disabled<br />
people<br />
Figure 5.5: Employment rates by disability type and severity, 2002<br />
Figure 5.5<br />
70<br />
%of work<strong>in</strong>g age population<br />
60<br />
50<br />
40<br />
30<br />
20<br />
10<br />
0<br />
All PWD<br />
MI<br />
MR<br />
Visual<br />
Hear<strong>in</strong>g<br />
Speech<br />
Locomo<strong>to</strong>r<br />
Multiple<br />
Moderate<br />
Severe<br />
Source: Mitra and Sambamoorthi, based on NSS 58 th round.<br />
5.6. A further important aspect of employment rates is variations between PWD and the<br />
general population by level of education. This is shown <strong>in</strong> Figures 5.6. and 5.7 for the early<br />
1990s and early 2000s. Two po<strong>in</strong>ts of <strong>in</strong>terest are:<br />
125 Census data also reveal significant differences <strong>in</strong> employment rates by disability type, though the<br />
relative rates differ significantly from those found us<strong>in</strong>g NSS. This is likely <strong>to</strong> be driven by the differences<br />
<strong>in</strong> def<strong>in</strong>itions of specific disabilities used by the two organizations (see Annex 1).<br />
-86-


