People with Disabilities in India: From Commitment to Outcomes
People with Disabilities in India: From Commitment to Outcomes
People with Disabilities in India: From Commitment to Outcomes
Create successful ePaper yourself
Turn your PDF publications into a flip-book with our unique Google optimized e-Paper software.
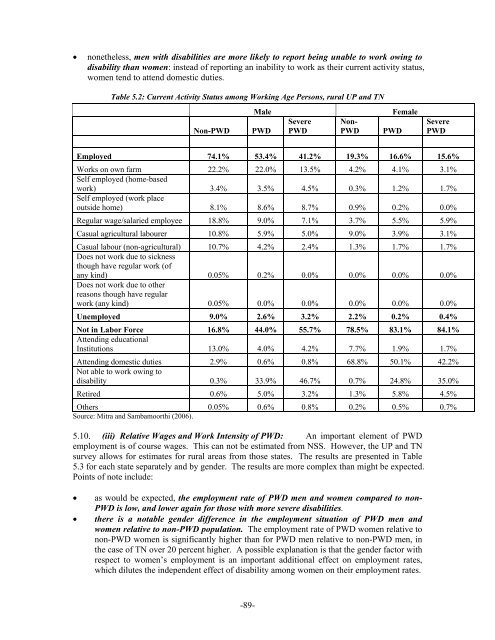
• nonetheless, men <strong>with</strong> disabilities are more likely <strong>to</strong> report be<strong>in</strong>g unable <strong>to</strong> work ow<strong>in</strong>g <strong>to</strong><br />
disability than women: <strong>in</strong>stead of report<strong>in</strong>g an <strong>in</strong>ability <strong>to</strong> work as their current activity status,<br />
women tend <strong>to</strong> attend domestic duties.<br />
Table 5.2: Current Activity Status among Work<strong>in</strong>g Age Persons, rural UP and TN<br />
Non-PWD<br />
Male<br />
PWD<br />
Severe<br />
PWD<br />
Non-<br />
PWD<br />
PWD<br />
Female<br />
Severe<br />
PWD<br />
Employed 74.1% 53.4% 41.2% 19.3% 16.6% 15.6%<br />
Works on own farm 22.2% 22.0% 13.5% 4.2% 4.1% 3.1%<br />
Self employed (home-based<br />
work) 3.4% 3.5% 4.5% 0.3% 1.2% 1.7%<br />
Self employed (work place<br />
outside home) 8.1% 8.6% 8.7% 0.9% 0.2% 0.0%<br />
Regular wage/salaried employee 18.8% 9.0% 7.1% 3.7% 5.5% 5.9%<br />
Casual agricultural labourer 10.8% 5.9% 5.0% 9.0% 3.9% 3.1%<br />
Casual labour (non-agricultural) 10.7% 4.2% 2.4% 1.3% 1.7% 1.7%<br />
Does not work due <strong>to</strong> sickness<br />
though have regular work (of<br />
any k<strong>in</strong>d) 0.05% 0.2% 0.0% 0.0% 0.0% 0.0%<br />
Does not work due <strong>to</strong> other<br />
reasons though have regular<br />
work (any k<strong>in</strong>d) 0.05% 0.0% 0.0% 0.0% 0.0% 0.0%<br />
Unemployed 9.0% 2.6% 3.2% 2.2% 0.2% 0.4%<br />
Not <strong>in</strong> Labor Force 16.8% 44.0% 55.7% 78.5% 83.1% 84.1%<br />
Attend<strong>in</strong>g educational<br />
Institutions 13.0% 4.0% 4.2% 7.7% 1.9% 1.7%<br />
Attend<strong>in</strong>g domestic duties 2.9% 0.6% 0.8% 68.8% 50.1% 42.2%<br />
Not able <strong>to</strong> work ow<strong>in</strong>g <strong>to</strong><br />
disability 0.3% 33.9% 46.7% 0.7% 24.8% 35.0%<br />
Retired 0.6% 5.0% 3.2% 1.3% 5.8% 4.5%<br />
Others 0.05% 0.6% 0.8% 0.2% 0.5% 0.7%<br />
Source: Mitra and Sambamoorthi (2006).<br />
5.10. (iii) Relative Wages and Work Intensity of PWD: An important element of PWD<br />
employment is of course wages. This can not be estimated from NSS. However, the UP and TN<br />
survey allows for estimates for rural areas from those states. The results are presented <strong>in</strong> Table<br />
5.3 for each state separately and by gender. The results are more complex than might be expected.<br />
Po<strong>in</strong>ts of note <strong>in</strong>clude:<br />
• as would be expected, the employment rate of PWD men and women compared <strong>to</strong> non-<br />
PWD is low, and lower aga<strong>in</strong> for those <strong>with</strong> more severe disabilities.<br />
• there is a notable gender difference <strong>in</strong> the employment situation of PWD men and<br />
women relative <strong>to</strong> non-PWD population. The employment rate of PWD women relative <strong>to</strong><br />
non-PWD women is significantly higher than for PWD men relative <strong>to</strong> non-PWD men, <strong>in</strong><br />
the case of TN over 20 percent higher. A possible explanation is that the gender fac<strong>to</strong>r <strong>with</strong><br />
respect <strong>to</strong> women’s employment is an important additional effect on employment rates,<br />
which dilutes the <strong>in</strong>dependent effect of disability among women on their employment rates.<br />
-89-


