

People with Disabilities in India: From Commitment to Outcomes
People with Disabilities in India: From Commitment to Outcomes
People with Disabilities in India: From Commitment to Outcomes

Create successful ePaper yourself
Turn your PDF publications into a flip-book with our unique Google optimized e-Paper software.
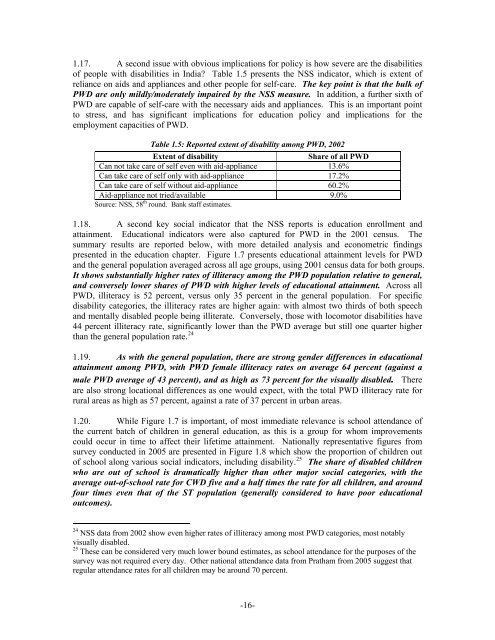
1.17. A second issue <strong>with</strong> obvious implications for policy is how severe are the disabilities<br />
of people <strong>with</strong> disabilities <strong>in</strong> <strong>India</strong>? Table 1.5 presents the NSS <strong>in</strong>dica<strong>to</strong>r, which is extent of<br />
reliance on aids and appliances and other people for self-care. The key po<strong>in</strong>t is that the bulk of<br />
PWD are only mildly/moderately impaired by the NSS measure. In addition, a further sixth of<br />
PWD are capable of self-care <strong>with</strong> the necessary aids and appliances. This is an important po<strong>in</strong>t<br />
<strong>to</strong> stress, and has significant implications for education policy and implications for the<br />
employment capacities of PWD.<br />
Table 1.5: Reported extent of disability among PWD, 2002<br />
Extent of disability<br />
Share of all PWD<br />
Can not take care of self even <strong>with</strong> aid-appliance 13.6%<br />
Can take care of self only <strong>with</strong> aid-appliance 17.2%<br />
Can take care of self <strong>with</strong>out aid-appliance 60.2%<br />
Aid-appliance not tried/available 9.0%<br />
Source: NSS, 58 th round. Bank staff estimates.<br />
1.18. A second key social <strong>in</strong>dica<strong>to</strong>r that the NSS reports is education enrollment and<br />
atta<strong>in</strong>ment. Educational <strong>in</strong>dica<strong>to</strong>rs were also captured for PWD <strong>in</strong> the 2001 census. The<br />
summary results are reported below, <strong>with</strong> more detailed analysis and econometric f<strong>in</strong>d<strong>in</strong>gs<br />
presented <strong>in</strong> the education chapter. Figure 1.7 presents educational atta<strong>in</strong>ment levels for PWD<br />
and the general population averaged across all age groups, us<strong>in</strong>g 2001 census data for both groups.<br />
It shows substantially higher rates of illiteracy among the PWD population relative <strong>to</strong> general,<br />
and conversely lower shares of PWD <strong>with</strong> higher levels of educational atta<strong>in</strong>ment. Across all<br />
PWD, illiteracy is 52 percent, versus only 35 percent <strong>in</strong> the general population. For specific<br />
disability categories, the illiteracy rates are higher aga<strong>in</strong>: <strong>with</strong> almost two thirds of both speech<br />
and mentally disabled people be<strong>in</strong>g illiterate. Conversely, those <strong>with</strong> locomo<strong>to</strong>r disabilities have<br />
44 percent illiteracy rate, significantly lower than the PWD average but still one quarter higher<br />
than the general population rate. 24<br />
1.19. As <strong>with</strong> the general population, there are strong gender differences <strong>in</strong> educational<br />
atta<strong>in</strong>ment among PWD, <strong>with</strong> PWD female illiteracy rates on average 64 percent (aga<strong>in</strong>st a<br />
male PWD average of 43 percent), and as high as 73 percent for the visually disabled. There<br />
are also strong locational differences as one would expect, <strong>with</strong> the <strong>to</strong>tal PWD illiteracy rate for<br />
rural areas as high as 57 percent, aga<strong>in</strong>st a rate of 37 percent <strong>in</strong> urban areas.<br />
1.20. While Figure 1.7 is important, of most immediate relevance is school attendance of<br />
the current batch of children <strong>in</strong> general education, as this is a group for whom improvements<br />
could occur <strong>in</strong> time <strong>to</strong> affect their lifetime atta<strong>in</strong>ment. Nationally representative figures from<br />
survey conducted <strong>in</strong> 2005 are presented <strong>in</strong> Figure 1.8 which show the proportion of children out<br />
of school along various social <strong>in</strong>dica<strong>to</strong>rs, <strong>in</strong>clud<strong>in</strong>g disability. 25 The share of disabled children<br />
who are out of school is dramatically higher than other major social categories, <strong>with</strong> the<br />
average out-of-school rate for CWD five and a half times the rate for all children, and around<br />
four times even that of the ST population (generally considered <strong>to</strong> have poor educational<br />
outcomes).<br />
24 NSS data from 2002 show even higher rates of illiteracy among most PWD categories, most notably<br />
visually disabled.<br />
25 These can be considered very much lower bound estimates, as school attendance for the purposes of the<br />
survey was not required every day. Other national attendance data from Pratham from 2005 suggest that<br />
regular attendance rates for all children may be around 70 percent.<br />
-16-


