

People with Disabilities in India: From Commitment to Outcomes
People with Disabilities in India: From Commitment to Outcomes
People with Disabilities in India: From Commitment to Outcomes

You also want an ePaper? Increase the reach of your titles
YUMPU automatically turns print PDFs into web optimized ePapers that Google loves.
• It is also important <strong>to</strong> recall Sen’s “conversion handicap” for disabled people, i.e. that<br />
equivalent levels of <strong>in</strong>come are less easily converted <strong>in</strong><strong>to</strong> <strong>in</strong>dividual welfare by PWD. Tak<strong>in</strong>g<br />
account of this fac<strong>to</strong>r would further widen the gap between PWD and non-PWD households.<br />
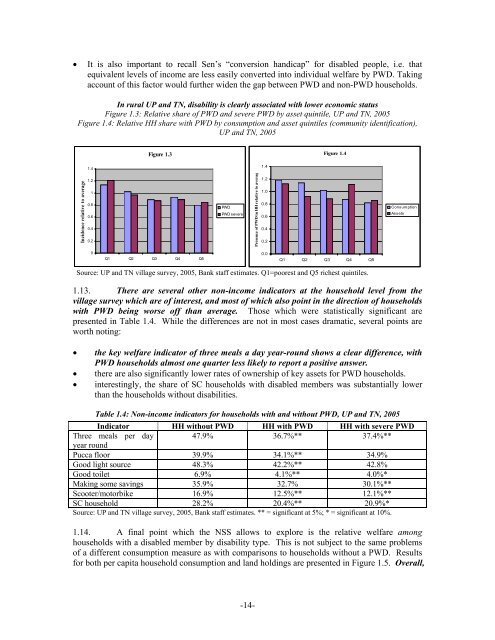
In rural UP and TN, disability is clearly associated <strong>with</strong> lower economic status<br />
Figure 1.3: Relative share of PWD and severe PWD by asset qu<strong>in</strong>tile, UP and TN, 2005<br />
Figure 1.4: Relative HH share <strong>with</strong> PWD by consumption and asset qu<strong>in</strong>tiles (community identification),<br />
UP and TN, 2005<br />
Figure 1.3<br />
Figure 1.4<br />
1.4<br />
1.4<br />
Incidence relative <strong>to</strong> average<br />
1.2<br />
1<br />
0.8<br />
0.6<br />
0.4<br />
0.2<br />
PWD<br />
PWD severe<br />
Presence of PWD <strong>in</strong> HH relative <strong>to</strong> averag<br />
1.2<br />
1.0<br />
0.8<br />
0.6<br />
0.4<br />
0.2<br />
Consumption<br />
Assets<br />
0<br />
Q1 Q2 Q3 Q4 Q5<br />
0.0<br />
Q1 Q2 Q3 Q4 Q5<br />
Source: UP and TN village survey, 2005, Bank staff estimates. Q1=poorest and Q5 richest qu<strong>in</strong>tiles.<br />
1.13. There are several other non-<strong>in</strong>come <strong>in</strong>dica<strong>to</strong>rs at the household level from the<br />
village survey which are of <strong>in</strong>terest, and most of which also po<strong>in</strong>t <strong>in</strong> the direction of households<br />
<strong>with</strong> PWD be<strong>in</strong>g worse off than average. Those which were statistically significant are<br />
presented <strong>in</strong> Table 1.4. While the differences are not <strong>in</strong> most cases dramatic, several po<strong>in</strong>ts are<br />
worth not<strong>in</strong>g:<br />
• the key welfare <strong>in</strong>dica<strong>to</strong>r of three meals a day year-round shows a clear difference, <strong>with</strong><br />
PWD households almost one quarter less likely <strong>to</strong> report a positive answer.<br />
• there are also significantly lower rates of ownership of key assets for PWD households.<br />
• <strong>in</strong>terest<strong>in</strong>gly, the share of SC households <strong>with</strong> disabled members was substantially lower<br />
than the households <strong>with</strong>out disabilities.<br />
Table 1.4: Non-<strong>in</strong>come <strong>in</strong>dica<strong>to</strong>rs for households <strong>with</strong> and <strong>with</strong>out PWD, UP and TN, 2005<br />
Indica<strong>to</strong>r HH <strong>with</strong>out PWD HH <strong>with</strong> PWD HH <strong>with</strong> severe PWD<br />
Three meals per day 47.9% 36.7%** 37.4%**<br />
year round<br />
Pucca floor 39.9% 34.1%** 34.9%<br />
Good light source 48.3% 42.2%** 42.8%<br />
Good <strong>to</strong>ilet 6.9% 4.1%** 4.0%*<br />
Mak<strong>in</strong>g some sav<strong>in</strong>gs 35.9% 32.7% 30.1%**<br />
Scooter/mo<strong>to</strong>rbike 16.9% 12.5%** 12.1%**<br />
SC household 28.2% 20.4%** 20.9%*<br />
Source: UP and TN village survey, 2005, Bank staff estimates. ** = significant at 5%; * = significant at 10%.<br />
1.14. A f<strong>in</strong>al po<strong>in</strong>t which the NSS allows <strong>to</strong> explore is the relative welfare among<br />
households <strong>with</strong> a disabled member by disability type. This is not subject <strong>to</strong> the same problems<br />
of a different consumption measure as <strong>with</strong> comparisons <strong>to</strong> households <strong>with</strong>out a PWD. Results<br />
for both per capita household consumption and land hold<strong>in</strong>gs are presented <strong>in</strong> Figure 1.5. Overall,<br />
-14-


