People with Disabilities in India: From Commitment to Outcomes
People with Disabilities in India: From Commitment to Outcomes
People with Disabilities in India: From Commitment to Outcomes
Create successful ePaper yourself
Turn your PDF publications into a flip-book with our unique Google optimized e-Paper software.
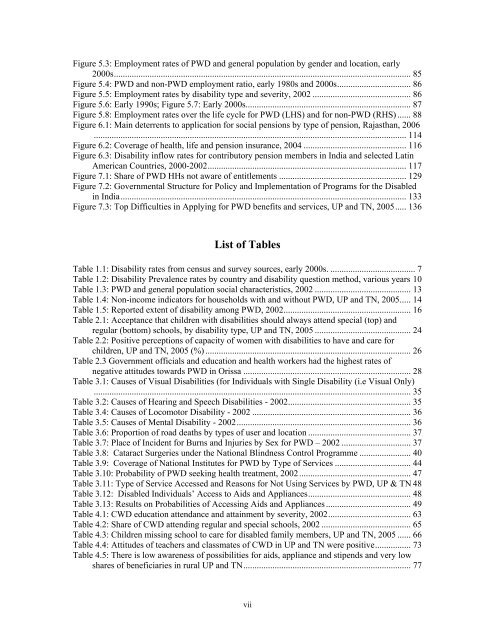
Figure 5.3: Employment rates of PWD and general population by gender and location, early<br />
2000s..................................................................................................................................... 85<br />
Figure 5.4: PWD and non-PWD employment ratio, early 1980s and 2000s................................. 86<br />
Figure 5.5: Employment rates by disability type and severity, 2002 ............................................ 86<br />
Figure 5.6: Early 1990s; Figure 5.7: Early 2000s.......................................................................... 87<br />
Figure 5.8: Employment rates over the life cycle for PWD (LHS) and for non-PWD (RHS) ...... 88<br />
Figure 6.1: Ma<strong>in</strong> deterrents <strong>to</strong> application for social pensions by type of pension, Rajasthan, 2006<br />
............................................................................................................................................ 114<br />
Figure 6.2: Coverage of health, life and pension <strong>in</strong>surance, 2004 .............................................. 116<br />
Figure 6.3: Disability <strong>in</strong>flow rates for contribu<strong>to</strong>ry pension members <strong>in</strong> <strong>India</strong> and selected Lat<strong>in</strong><br />
American Countries, 2000-2002......................................................................................... 117<br />
Figure 7.1: Share of PWD HHs not aware of entitlements ......................................................... 129<br />
Figure 7.2: Governmental Structure for Policy and Implementation of Programs for the Disabled<br />
<strong>in</strong> <strong>India</strong>................................................................................................................................ 133<br />
Figure 7.3: Top Difficulties <strong>in</strong> Apply<strong>in</strong>g for PWD benefits and services, UP and TN, 2005..... 136<br />
List of Tables<br />
Table 1.1: Disability rates from census and survey sources, early 2000s. ...................................... 7<br />
Table 1.2: Disability Prevalence rates by country and disability question method, various years 10<br />
Table 1.3: PWD and general population social characteristics, 2002 ........................................... 13<br />
Table 1.4: Non-<strong>in</strong>come <strong>in</strong>dica<strong>to</strong>rs for households <strong>with</strong> and <strong>with</strong>out PWD, UP and TN, 2005..... 14<br />
Table 1.5: Reported extent of disability among PWD, 2002......................................................... 16<br />
Table 2.1: Acceptance that children <strong>with</strong> disabilities should always attend special (<strong>to</strong>p) and<br />
regular (bot<strong>to</strong>m) schools, by disability type, UP and TN, 2005 ........................................... 24<br />
Table 2.2: Positive perceptions of capacity of women <strong>with</strong> disabilities <strong>to</strong> have and care for<br />
children, UP and TN, 2005 (%) ............................................................................................ 26<br />
Table 2.3 Government officials and education and health workers had the highest rates of<br />
negative attitudes <strong>to</strong>wards PWD <strong>in</strong> Orissa ........................................................................... 28<br />
Table 3.1: Causes of Visual <strong>Disabilities</strong> (for Individuals <strong>with</strong> S<strong>in</strong>gle Disability (i.e Visual Only)<br />
.............................................................................................................................................. 35<br />
Table 3.2: Causes of Hear<strong>in</strong>g and Speech <strong>Disabilities</strong> - 2002....................................................... 35<br />
Table 3.4: Causes of Locomo<strong>to</strong>r Disability - 2002 ....................................................................... 36<br />
Table 3.5: Causes of Mental Disability - 2002.............................................................................. 36<br />
Table 3.6: Proportion of road deaths by types of user and location .............................................. 37<br />
Table 3.7: Place of Incident for Burns and Injuries by Sex for PWD – 2002 ............................... 37<br />
Table 3.8: Cataract Surgeries under the National Bl<strong>in</strong>dness Control Programme ....................... 40<br />
Table 3.9: Coverage of National Institutes for PWD by Type of Services .................................. 44<br />
Table 3.10: Probability of PWD seek<strong>in</strong>g health treatment, 2002.................................................. 47<br />
Table 3.11: Type of Service Accessed and Reasons for Not Us<strong>in</strong>g Services by PWD, UP & TN 48<br />
Table 3.12: Disabled Individuals’ Access <strong>to</strong> Aids and Appliances.............................................. 48<br />
Table 3.13: Results on Probabilities of Access<strong>in</strong>g Aids and Appliances ...................................... 49<br />
Table 4.1: CWD education attendance and atta<strong>in</strong>ment by severity, 2002..................................... 63<br />
Table 4.2: Share of CWD attend<strong>in</strong>g regular and special schools, 2002 ........................................ 65<br />
Table 4.3: Children miss<strong>in</strong>g school <strong>to</strong> care for disabled family members, UP and TN, 2005 ...... 66<br />
Table 4.4: Attitudes of teachers and classmates of CWD <strong>in</strong> UP and TN were positive................ 73<br />
Table 4.5: There is low awareness of possibilities for aids, appliance and stipends and very low<br />
shares of beneficiaries <strong>in</strong> rural UP and TN........................................................................... 77<br />
vii


