

People with Disabilities in India: From Commitment to Outcomes
People with Disabilities in India: From Commitment to Outcomes
People with Disabilities in India: From Commitment to Outcomes

Create successful ePaper yourself
Turn your PDF publications into a flip-book with our unique Google optimized e-Paper software.
2.12. Interest<strong>in</strong>gly however, <strong>with</strong> respect <strong>to</strong> participation <strong>in</strong> community activities, qualitative<br />
work <strong>with</strong> the same communities found that the <strong>in</strong>itially positive responses weakened dur<strong>in</strong>g<br />
deeper discussion, <strong>with</strong> concerns for certa<strong>in</strong> celebrations such as wedd<strong>in</strong>gs that the presence of<br />
PWD may be <strong>in</strong>auspicious. This more nuanced situation is supported by research from Orissa<br />
f<strong>in</strong>d<strong>in</strong>g low rates of participation by disabled women <strong>in</strong> religious and social life, <strong>with</strong> the situation<br />
much worse for women <strong>with</strong> mental impairments. 42 Research <strong>in</strong> Gujarat has also found that<br />
people <strong>with</strong> disabilities attended only around half of social and religious functions and were often<br />
discouraged from attend<strong>in</strong>g marriages. 43 With respect <strong>to</strong> local political participation, households<br />
<strong>with</strong> PWD had similar (high) vot<strong>in</strong>g rates <strong>to</strong> non-PWD households <strong>in</strong> gram sabha elections,<br />
though somewhat lower attendance rates as meet<strong>in</strong>gs.<br />
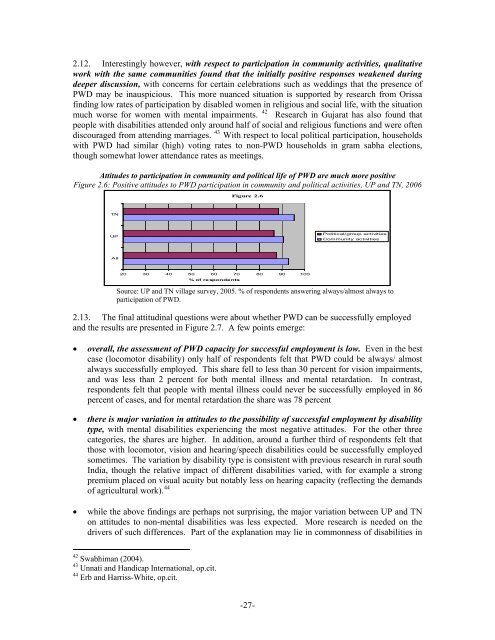
Attitudes <strong>to</strong> participation <strong>in</strong> community and political life of PWD are much more positive<br />
Figure 2.6: Positive attitudes <strong>to</strong> PWD participation <strong>in</strong> community and political activities, UP and TN, 2006<br />
Figure 2.6<br />
TN<br />
UP<br />
Political/group activities<br />
Community activities<br />
All<br />
20 30 40 50 60 70 80 90 100<br />
% of respondents<br />
Source: UP and TN village survey, 2005. % of respondents answer<strong>in</strong>g always/almost always <strong>to</strong><br />
participation of PWD.<br />
2.13. The f<strong>in</strong>al attitud<strong>in</strong>al questions were about whether PWD can be successfully employed<br />
and the results are presented <strong>in</strong> Figure 2.7. A few po<strong>in</strong>ts emerge:<br />
• overall, the assessment of PWD capacity for successful employment is low. Even <strong>in</strong> the best<br />
case (locomo<strong>to</strong>r disability) only half of respondents felt that PWD could be always/ almost<br />
always successfully employed. This share fell <strong>to</strong> less than 30 percent for vision impairments,<br />
and was less than 2 percent for both mental illness and mental retardation. In contrast,<br />
respondents felt that people <strong>with</strong> mental illness could never be successfully employed <strong>in</strong> 86<br />
percent of cases, and for mental retardation the share was 78 percent<br />
• there is major variation <strong>in</strong> attitudes <strong>to</strong> the possibility of successful employment by disability<br />
type, <strong>with</strong> mental disabilities experienc<strong>in</strong>g the most negative attitudes. For the other three<br />
categories, the shares are higher. In addition, around a further third of respondents felt that<br />
those <strong>with</strong> locomo<strong>to</strong>r, vision and hear<strong>in</strong>g/speech disabilities could be successfully employed<br />
sometimes. The variation by disability type is consistent <strong>with</strong> previous research <strong>in</strong> rural south<br />
<strong>India</strong>, though the relative impact of different disabilities varied, <strong>with</strong> for example a strong<br />
premium placed on visual acuity but notably less on hear<strong>in</strong>g capacity (reflect<strong>in</strong>g the demands<br />
of agricultural work). 44<br />
• while the above f<strong>in</strong>d<strong>in</strong>gs are perhaps not surpris<strong>in</strong>g, the major variation between UP and TN<br />
on attitudes <strong>to</strong> non-mental disabilities was less expected. More research is needed on the<br />
drivers of such differences. Part of the explanation may lie <strong>in</strong> commonness of disabilities <strong>in</strong><br />
42 Swabhiman (2004).<br />
43 Unnati and Handicap International, op.cit.<br />
44 Erb and Harriss-White, op.cit.<br />
-27-


