

People with Disabilities in India: From Commitment to Outcomes
People with Disabilities in India: From Commitment to Outcomes
People with Disabilities in India: From Commitment to Outcomes

You also want an ePaper? Increase the reach of your titles
YUMPU automatically turns print PDFs into web optimized ePapers that Google loves.
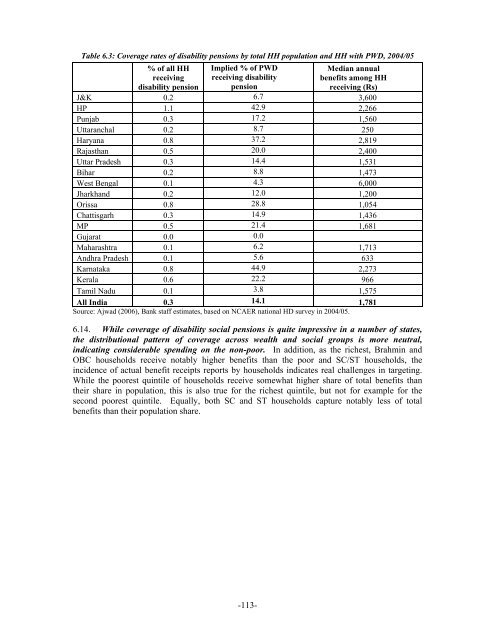
Table 6.3: Coverage rates of disability pensions by <strong>to</strong>tal HH population and HH <strong>with</strong> PWD, 2004/05<br />
% of all HH<br />
receiv<strong>in</strong>g<br />
disability pension<br />
Implied % of PWD<br />
receiv<strong>in</strong>g disability<br />
pension<br />
Median annual<br />
benefits among HH<br />
receiv<strong>in</strong>g (Rs)<br />
J&K 0.2 6.7 3,600<br />
HP 1.1 42.9 2,266<br />
Punjab 0.3 17.2 1,560<br />
Uttaranchal 0.2 8.7 250<br />
Haryana 0.8 37.2 2,819<br />
Rajasthan 0.5 20.0 2,400<br />
Uttar Pradesh 0.3 14.4 1,531<br />
Bihar 0.2 8.8 1,473<br />
West Bengal 0.1 4.3 6,000<br />
Jharkhand 0.2 12.0 1,200<br />
Orissa 0.8 28.8 1,054<br />
Chattisgarh 0.3 14.9 1,436<br />
MP 0.5 21.4 1,681<br />
Gujarat 0.0 0.0<br />
Maharashtra 0.1 6.2 1,713<br />
Andhra Pradesh 0.1 5.6 633<br />
Karnataka 0.8 44.9 2,273<br />
Kerala 0.6 22.2 966<br />
Tamil Nadu 0.1 3.8 1,575<br />
All <strong>India</strong> 0.3 14.1 1,781<br />
Source: Ajwad (2006), Bank staff estimates, based on NCAER national HD survey <strong>in</strong> 2004/05.<br />
6.14. While coverage of disability social pensions is quite impressive <strong>in</strong> a number of states,<br />
the distributional pattern of coverage across wealth and social groups is more neutral,<br />
<strong>in</strong>dicat<strong>in</strong>g considerable spend<strong>in</strong>g on the non-poor. In addition, as the richest, Brahm<strong>in</strong> and<br />
OBC households receive notably higher benefits than the poor and SC/ST households, the<br />
<strong>in</strong>cidence of actual benefit receipts reports by households <strong>in</strong>dicates real challenges <strong>in</strong> target<strong>in</strong>g.<br />
While the poorest qu<strong>in</strong>tile of households receive somewhat higher share of <strong>to</strong>tal benefits than<br />
their share <strong>in</strong> population, this is also true for the richest qu<strong>in</strong>tile, but not for example for the<br />
second poorest qu<strong>in</strong>tile. Equally, both SC and ST households capture notably less of <strong>to</strong>tal<br />
benefits than their population share.<br />
-113-


