- Page 3 and 4:
JUNOS Cookbook
- Page 5 and 6:
JUNOS Cookbook Aviva Garrett Beijin
- Page 7 and 8:
Table of Contents Foreword . . . .
- Page 9 and 10:
3. IPSec . . . . . . . . . . . . .
- Page 11 and 12:
8.5 Creating Static Routes 263 8.6
- Page 13 and 14:
13.5 Adjusting Local Preference Val
- Page 15 and 16:
Foreword The early days at Juniper
- Page 17 and 18:
Throughout 1997 and early 1998, all
- Page 19 and 20:
Preface1 Over the past decade, netw
- Page 21 and 22:
Organization As the name suggests,
- Page 23 and 24:
Constant width Used for code sectio
- Page 25 and 26:
Chapter 1 CHAPTER 1 Router Configur
- Page 27 and 28:
You can use a number of operational
- Page 29 and 30:
The show command displays the items
- Page 31 and 32:
Each listed completion is the confi
- Page 33 and 34:
command on the left side of the pip
- Page 35 and 36:
The > tells you that you are in ope
- Page 37 and 38:
} } } root@# commit root@router1# e
- Page 39 and 40:
For the initial router configuratio
- Page 41 and 42:
At this point in configuring the ro
- Page 43 and 44:
1.4 Displaying the Commands to Recr
- Page 45 and 46:
Discussion It is generally good pra
- Page 47 and 48:
is often the first thing to check w
- Page 49 and 50:
In this example, the error is in th
- Page 51 and 52:
To track down what changed in the c
- Page 53 and 54:
Solution Use the following command
- Page 55 and 56:
login { class superuser-local { per
- Page 57 and 58:
If PIM is not yet configured, merge
- Page 59 and 60:
You can also save it to a file in y
- Page 61 and 62:
These files are also compressed. av
- Page 63 and 64:
You see that the running configurat
- Page 65 and 66:
Solution The rollback configuration
- Page 67 and 68:
See Also Recipe 1.17 1.19 Backing U
- Page 69 and 70:
ad1 11513 MB IBM-DARA-212000 AH0AHG
- Page 71 and 72:
J-series filesystems on a device co
- Page 73 and 74:
1.22 Installing a Different Softwar
- Page 75 and 76:
Use the request system software add
- Page 77 and 78:
support site (http://www.juniper.ne
- Page 79 and 80:
JUNOS 7.0 was released in the fourt
- Page 81 and 82:
Some of the main processes are MGD,
- Page 83 and 84:
switching board (the SSB), and two
- Page 85 and 86:
1.28 Gathering Information Before C
- Page 87 and 88:
The apply-groups statement causes t
- Page 89 and 90:
} } } address 10.0.16.1/24; Finally
- Page 91 and 92:
The commit synchronize command comm
- Page 93 and 94:
modules/ packages/ proc/ root/ sbin
- Page 95 and 96:
At this point, you can also upgrade
- Page 97 and 98:
lets them gain access to the router
- Page 99 and 100:
client/server systems—the RADIUS
- Page 101 and 102:
You need to enable FTP only if you
- Page 103 and 104:
use of the root account. Logging in
- Page 105 and 106:
A slight twist to this recipe is to
- Page 107 and 108:
Also, you will not be able to commi
- Page 109 and 110:
Solution Set all plain-text passwor
- Page 111 and 112:
Discussion When you want users to b
- Page 113 and 114:
individual user accounts with passw
- Page 115 and 116:
ead-only Can perform all actions in
- Page 117 and 118:
If you try to enter a command that
- Page 119 and 120: aviva@router1# set class operator-p
- Page 121 and 122: If you use a centralized server, it
- Page 123 and 124: aviva@RouterF# set term ssh-telnet
- Page 125 and 126: statement in the configuration, whi
- Page 127 and 128: een idle, and what they are doing.
- Page 129 and 130: Mike would be logged out: mike@rout
- Page 131 and 132: Encryption, which is the encoding o
- Page 133 and 134: networks, it does not scale well. A
- Page 135 and 136: } } [edit interfaces] es-3/0/0 { #
- Page 137 and 138: have to set up an IKE SA and a fire
- Page 139 and 140: Here’s what the relevant portions
- Page 141 and 142: Finally, configure the domain’s I
- Page 143 and 144: Configure the security gateway rout
- Page 145 and 146: [edit protocols ospf area 0.0.0.0]
- Page 147 and 148: Then, configure the IPSec tunnel to
- Page 149 and 150: Issuer: Organization: mycompany, Co
- Page 151 and 152: Alternate subject: RouterB.mycompan
- Page 153 and 154: Chapter 4 CHAPTER 4 SNMP4 4.0 Intro
- Page 155 and 156: juniperMIB, which is the top node o
- Page 157 and 158: Juniper Networks provides several d
- Page 159 and 160: 4.2 Setting Router Information for
- Page 161 and 162: Table 4-1. SNMP trap categories Key
- Page 163 and 164: Solution You can add a term to the
- Page 165 and 166: You might want to give access to al
- Page 167 and 168: aviva@router1> show snmp mib get "j
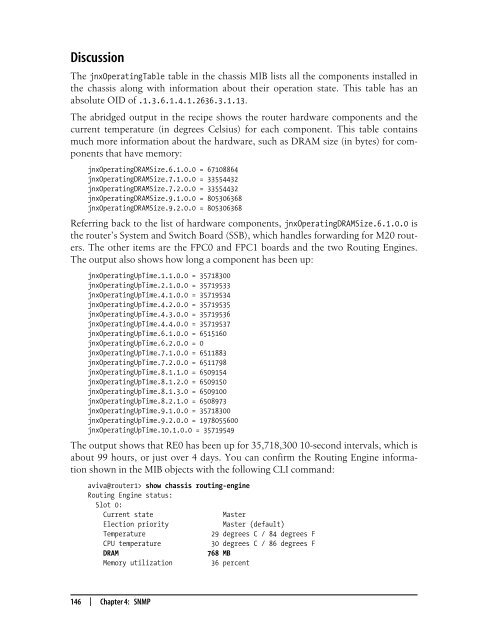
- Page 169: 4.9 Collecting Router Operational I
- Page 173 and 174: Table 4-2. System logging severity
- Page 175 and 176: Discussion RMON is an SNMP specific
- Page 177 and 178: See Also RFC 2819, Remote Network M
- Page 179 and 180: nms1 sha/3des nonvolatile active Gr
- Page 181 and 182: Again, this recipe is somewhat invo
- Page 183 and 184: Finally, configure which traps the
- Page 185 and 186: } notify chassis-notification-list
- Page 187 and 188: Some are the same as those used by
- Page 189 and 190: Solution Use the following commands
- Page 191 and 192: 5.2 Limiting the Messages Collected
- Page 193 and 194: Discussion The default maximum size
- Page 195 and 196: no longer need. Here, we logged RIP
- Page 197 and 198: Discussion This configuration redir
- Page 199 and 200: This command causes all messages se
- Page 201 and 202: Apr 29 22:55:16 router xntpd[4977]:
- Page 203 and 204: The traceoption flags indicate the
- Page 205 and 206: Chapter 6 CHAPTER 6 NTP6 6.0 Introd
- Page 207 and 208: 6.2 Setting the Time Zone Problem Y
- Page 209 and 210: Engine boots, the ntpdate utility r
- Page 211 and 212: You can also have all the routers s
- Page 213 and 214: 6.6 Checking NTP Status Problem You
- Page 215 and 216: Chapter 7 CHAPTER 7 Router Interfac
- Page 217 and 218: under the name of the interface and
- Page 219 and 220: Solution Use the show interfaces co
- Page 221 and 222:
the physical interface. It allows y
- Page 223 and 224:
Solution The show interfaces extens
- Page 225 and 226:
Broadcast packets 0 [0] Multicast p
- Page 227 and 228:
Input packets : 5 Output packets: 5
- Page 229 and 230:
1.0.12.2/30 so-1/0/0 Mars 1.0.0.1/3
- Page 231 and 232:
To remove an extra IP address, use
- Page 233 and 234:
Discussion For MPLS traffic to tran
- Page 235 and 236:
Flags: None Addresses, Flags: Is-Pr
- Page 237 and 238:
Solution Configure the router’s m
- Page 239 and 240:
On an M-series or a T-series router
- Page 241 and 242:
You can confirm the presence of the
- Page 243 and 244:
Protocol inet6, MTU: 1500 Flags: Is
- Page 245 and 246:
Solution Use the Virtual Router Red
- Page 247 and 248:
Solution There are three steps to s
- Page 249 and 250:
7.16 Configuring T1 Interfaces Prob
- Page 251 and 252:
Run the loopback test, which sends
- Page 253 and 254:
7.18 Setting Up a BERT Test on a T1
- Page 255 and 256:
You can configure an error rate to
- Page 257 and 258:
Discussion Synchronous Optical Netw
- Page 259 and 260:
SEF 22 182 OK LOS 22 1 OK LOF 22 1
- Page 261 and 262:
Use the show aps command to check t
- Page 263 and 264:
type of ATM PIC, the configuration
- Page 265 and 266:
gre up ipip up lo0 up up lo0.0 up u
- Page 267 and 268:
Solution Add the new interface to t
- Page 269 and 270:
While this does what you want, it m
- Page 271 and 272:
When a single routing protocol prov
- Page 273 and 274:
IPv6 uses 128-bit addresses that co
- Page 275 and 276:
8.1 Viewing the Routes in the Routi
- Page 277 and 278:
oute is learned from a dynamic rout
- Page 279 and 280:
} } family iso { address 49.0020.19
- Page 281 and 282:
8.2 Viewing Routes to a Particular
- Page 283 and 284:
8.3 Viewing Routes Learned from a S
- Page 285 and 286:
ff00::/8 perm 0 mdsc 53 1 ff02::1/1
- Page 287 and 288:
The actual forwarding tables that t
- Page 289 and 290:
and the traffic to these networks i
- Page 291 and 292:
Attacker A B Target Real source add
- Page 293 and 294:
Check the firewall filter counts wi
- Page 295 and 296:
Solution Create a routing policy th
- Page 297 and 298:
Discussion Martian addresses are pr
- Page 299 and 300:
Solution After configuring both OSP
- Page 301 and 302:
To verify the preference change, lo
- Page 303 and 304:
Peer supports Refresh capability (2
- Page 305 and 306:
This recipe shows how to enable gra
- Page 307 and 308:
Because the policy and filter condi
- Page 309 and 310:
then accept; } } } protocols { ospf
- Page 311 and 312:
The first command in the recipe def
- Page 313 and 314:
[edit] aviva@router1# set protocols
- Page 315 and 316:
Table 9-4. Actions that change rout
- Page 317 and 318:
(called longest-match lookup), so t
- Page 319 and 320:
aviva@router1# set term 2 then reje
- Page 321 and 322:
See Also IANA, http://www.iana.org/
- Page 323 and 324:
the community string from the route
- Page 325 and 326:
used to verify that the router is m
- Page 327 and 328:
} } Discussion } } Placing firewall
- Page 329 and 330:
Table 9-5. Header match conditions
- Page 331 and 332:
counterintuitive. However, understa
- Page 333 and 334:
protocol-except tcp; } then { count
- Page 335 and 336:
protocol tcp; destination-port [ te
- Page 337 and 338:
Firewall filter terms are evaluated
- Page 339 and 340:
9.12 Using a Firewall Filter to Cou
- Page 341 and 342:
04:58:41 pfe A t1-0/0/3.0 TCP 10.0.
- Page 343 and 344:
which traffic is more important and
- Page 345 and 346:
The next term allows TCP traffic: [
- Page 347 and 348:
Routing Engine, you want to make su
- Page 349 and 350:
from { source-address { 10.0.8.0/24
- Page 351 and 352:
9.16 Rate-Limiting Traffic Flow to
- Page 353 and 354:
list of IP addresses in one place i
- Page 355 and 356:
lished TCP connections and you sudd
- Page 357 and 358:
By default, the JUNOS software impl
- Page 359 and 360:
} } } neighbor fe-0/0/0.0; neighbor
- Page 361 and 362:
10.0.0.0/24 *[Direct/0] 2w4d 23:05:
- Page 363 and 364:
The routing policy you set up is a
- Page 365 and 366:
so the inbound metrics are 1. The m
- Page 367 and 368:
can use it in the authentication-ke
- Page 369 and 370:
10.6 Sending Version 1 Update Messa
- Page 371 and 372:
Mar 31 10:11:13 Group beta-rip-grou
- Page 373 and 374:
Chapter 11 CHAPTER 11 IS-IS11 11.0
- Page 375 and 376:
oundary. This means that the IS-IS
- Page 377 and 378:
might be useful when migrating two
- Page 379 and 380:
Interface System L State Hold (secs
- Page 381 and 382:
RouterA.02-00 0x59 0xeda9 632 L1 L2
- Page 383 and 384:
The next four lines show the IP pre
- Page 385 and 386:
configuring the preference statemen
- Page 387 and 388:
11.5 Configuring a Level 1-Only Rou
- Page 389 and 390:
11.6 Controlling DIS Election Probl
- Page 391 and 392:
key, or password, for each interfac
- Page 393 and 394:
} } from protocol static; then acce
- Page 395 and 396:
Again, we expect the metric to chan
- Page 397 and 398:
RouterA Level 2 RouterB Level 2 Rou
- Page 399 and 400:
Increasing the IS-IS cost of Router
- Page 401 and 402:
11.12 Moving IS-IS Traffic off a Ro
- Page 403 and 404:
11.14 Tracing IS-IS Protocol Traffi
- Page 405 and 406:
Using some of the other flags, you
- Page 407 and 408:
OSPF views routers as nodes, which
- Page 409 and 410:
Area 0.0.0.0 RouterG lo0:192.168.19
- Page 411 and 412:
Another common problem in establish
- Page 413 and 414:
The route entries starting with [OS
- Page 415 and 416:
entries that originated from the lo
- Page 417 and 418:
OSPF network. Route 192.168.18.1:0.
- Page 419 and 420:
Checking on RouterA at the other en
- Page 421 and 422:
192.168.19.1/32 *[Direct/0] 3d 01:5
- Page 423 and 424:
The routers in the stub area no lon
- Page 425 and 426:
Router 192.168.16.1 192.168.16.1 0x
- Page 427 and 428:
Solution You configure MD5 authenti
- Page 429 and 430:
Use the show ospf interface detail
- Page 431 and 432:
With the default metric, traffic fr
- Page 433 and 434:
12.12 Improving OSPF Convergence Ti
- Page 435 and 436:
This output shows two BFD sessions
- Page 437 and 438:
aviva@RouterG# commit aviva@RouterG
- Page 439 and 440:
Jun 14 22:00:26 CHANGE 192.168.17.1
- Page 441 and 442:
Jun 13 16:55:20 IP Route added with
- Page 443 and 444:
list of ASs to see whether a route
- Page 445 and 446:
E Route was originally learned from
- Page 447 and 448:
Then configure an EBGP session to t
- Page 449 and 450:
NLRI for this session: inet-unicast
- Page 451 and 452:
Next is information about routes le
- Page 453 and 454:
Looking at the remote peer router,
- Page 455 and 456:
* 10.0.31.0/24 Self I * 172.19.121.
- Page 457 and 458:
aviva@RouterE> show bgp summary Gro
- Page 459 and 460:
to 10.0.31.1 via t1-0/0/3.0 10.0.29
- Page 461 and 462:
lem with BGP itself. When the TCP s
- Page 463 and 464:
13.4 Adjusting the Next-Hop Attribu
- Page 465 and 466:
The first configuration in this rec
- Page 467 and 468:
13.7 Prepending AS Numbers to the A
- Page 469 and 470:
13.8 Filtering BGP Routes Based on
- Page 471 and 472:
Translated, this match looks for fo
- Page 473 and 474:
Type: External State: Established F
- Page 475 and 476:
This recipe configures MD5 authenti
- Page 477 and 478:
oute reflector system has a set of
- Page 479 and 480:
10.0.24.0/24 *[BGP/170] 00:18:38, l
- Page 481 and 482:
AS 65500 Sub-AS 65501 RouterF 192.1
- Page 483 and 484:
figure-of-merit value correlates to
- Page 485 and 486:
Once the routing policy is set up,
- Page 487 and 488:
change, the router will unsuppress
- Page 489 and 490:
See Also RFC 2439, BGP Route Flap D
- Page 491 and 492:
You see that the route to 192.168.1
- Page 493 and 494:
When setting up policies, also crea
- Page 495 and 496:
} See Also next-hop 192.0.2.1; acce
- Page 497 and 498:
Another restriction for multipath B
- Page 499 and 500:
This forwarding table is then copie
- Page 501 and 502:
BGP establishes the connection, fro
- Page 503 and 504:
Chapter 14a CHAPTER 14 MPLS14 14.0
- Page 505 and 506:
Layer 2 header MPLS header Layer 3
- Page 507 and 508:
RouterG 192.168.19.1 Ingress router
- Page 509 and 510:
The main difference between LDP and
- Page 511 and 512:
family to the t1-4/0/0 interface; o
- Page 513 and 514:
Also verify the MPLS-enabled interf
- Page 515 and 516:
The first line of the output shows
- Page 517 and 518:
aviva@RouterG> show configuration p
- Page 519 and 520:
via t1-4/0/0.0, Push 100000 192.168
- Page 521 and 522:
aviva@RouterG> show route forwardin
- Page 523 and 524:
This recipe shows how to configure
- Page 525 and 526:
Oct 5 19:25:52 Msg Hello (0x100), l
- Page 527 and 528:
aviva@R3# set rsvp interface fxp0.0
- Page 529 and 530:
fxp0 up up fxp0.0 up up inet 192.16
- Page 531 and 532:
aviva@R1> show rsvp interface RSVP
- Page 533 and 534:
y 13:31:06 the LSP was up and runni
- Page 535 and 536:
10.0.0.6 10.0.0.1 Up 0 1 FF 3 - R1-
- Page 537 and 538:
Solution On the ingress router, loo
- Page 539 and 540:
for LSP signaling. On the egress an
- Page 541 and 542:
Discussion There are several ways t
- Page 543 and 544:
14.9 Verifying that the RSVP-Signal
- Page 545 and 546:
14.11 Protecting an LSP’s Path Pr
- Page 547 and 548:
RSVP RRO in the path calculation lo
- Page 549 and 550:
The configuration allocates 50 Mbps
- Page 551 and 552:
However, RSVP cannot establish the
- Page 553 and 554:
Solution Fast reroute reduces packe
- Page 555 and 556:
PATH sentto: 10.1.13.2 (so-0/0/2.0)
- Page 557 and 558:
The RSVP interface status shows tha
- Page 559 and 560:
14.13 Automatically Allocating Band
- Page 561 and 562:
Then examine the history of the LSP
- Page 563 and 564:
To understand how preemption works,
- Page 565 and 566:
10.0.0.5 From: 10.0.0.1, State: Up,
- Page 567 and 568:
9 Oct 14 10:51:20 Deselected as act
- Page 569 and 570:
The router knows how to reach its i
- Page 571 and 572:
10.1.13.1/32 *[Local/0] 2d 20:39:51
- Page 573 and 574:
aviva@R1> clear log rsvp-trace-log
- Page 575 and 576:
PATH rcvfrom: 10.1.13.2 (so-0/0/2.0
- Page 577 and 578:
The discussion of Layer 3 VPNs invo
- Page 579 and 580:
VPN, and routes announced by a remo
- Page 581 and 582:
The third and final step is to conf
- Page 583 and 584:
One last protocol that you need to
- Page 585 and 586:
All routes that are part of the VPN
- Page 587 and 588:
--- 192.168.13.1 ping statistics --
- Page 589 and 590:
1 *[MPLS/0] 1d 18:03:41, metric 1 R
- Page 591 and 592:
65500:3:10.0.31.0/24 *[BGP/170] 00:
- Page 593 and 594:
emains private. When configuring th
- Page 595 and 596:
} } peer-as 65500; neighbor 10.0.1.
- Page 597 and 598:
The VPN2 routing table also knows n
- Page 599 and 600:
Just to make sure that prefixes are
- Page 601 and 602:
Multicast senders and receivers are
- Page 603 and 604:
You administratively configure the
- Page 605 and 606:
10.0.21.2/24 RouterB 192.168.12.1 R
- Page 607 and 608:
IGMP Last Member Query Interval: 1.
- Page 609 and 610:
Again, verify the configured group
- Page 611 and 612:
willing to be an RP send RP Announc
- Page 613 and 614:
JUNOS routers perform the encapsula
- Page 615 and 616:
Now check the RP status on the rout
- Page 617 and 618:
Also, make sure that the router’s
- Page 619 and 620:
Check to see which RPs the various
- Page 621 and 622:
The anycast PIM configuration is qu
- Page 623 and 624:
Solution Specify the group address
- Page 625 and 626:
The interfaces toward the multicast
- Page 627 and 628:
Discussion Flags: sparse Upstream i
- Page 629 and 630:
IGMP Query Response Interval: 10.0
- Page 631 and 632:
If you are not sure that the domain
- Page 633 and 634:
Discussion With PIM-SM, the RP in e
- Page 635 and 636:
The full RIB group configuration lo
- Page 637 and 638:
} address 192.168.19.1; # ping 224
- Page 639 and 640:
Upstream interface: local Upstream
- Page 641 and 642:
The first entry is for the source i
- Page 643 and 644:
IGMP Last Member Query Interval: 1.
- Page 645:
The command in this recipe is a sim
- Page 648 and 649:
adjacencies (continued) IGPs and, 1
- Page 650 and 651:
BGP (Border Gateway Protocol) (cont
- Page 652 and 653:
configure command (continued) exclu
- Page 654 and 655:
dotted quad notation, 248 down arro
- Page 656 and 657:
firewall filters (continued) loggin
- Page 658 and 659:
IBGP (internal BGP) (continued) LOC
- Page 660 and 661:
IP multicast (continued) limiting g
- Page 662 and 663:
Level 1 systems (IS-IS) authenticat
- Page 664 and 665:
martian addresses/prefixes (continu
- Page 666 and 667:
O Object Identifier (see OID) OID (
- Page 668 and 669:
plain-text passwords (continued) JU
- Page 670 and 671:
RFC (Request for Comment) on BGP, 4
- Page 672 and 673:
outing tables (continued) checking
- Page 674 and 675:
set route-filter command, 296 set r
- Page 676 and 677:
show ospf interface command, 386, 3
- Page 678 and 679:
ssh command, 3, 89 SSM (Source-Spec
- Page 680 and 681:
tracing (trace logging) (continued)
- Page 683:
About the Author Aviva Garrett has