Experimental and Numerical Analysis of a PCM-Supported ...
Experimental and Numerical Analysis of a PCM-Supported ...
Experimental and Numerical Analysis of a PCM-Supported ...

You also want an ePaper? Increase the reach of your titles
YUMPU automatically turns print PDFs into web optimized ePapers that Google loves.
decreases. The percentage deviation for the evaporator <strong>and</strong> condenser lies within<br />
±5% at low <strong>and</strong> high operating temperatures.<br />
However, it can be observed that all the temperature fields for fluid phases follow the<br />
<strong>PCM</strong> temperature trends, as they remain constant during the isothermal phase<br />
change processes. Up to this point, the <strong>PCM</strong> role as a temporary heat storage <strong>and</strong><br />
heat exchanger become obvious both experimentally <strong>and</strong> theoretically regardless<br />
whether it has negative or positive effects under the present boundary <strong>and</strong><br />
geometrical conditions <strong>and</strong> thermophysical properties <strong>of</strong> designated <strong>PCM</strong> beads.<br />
Figure (6.4) shows that the outlet liquid <strong>and</strong> gas temperatures <strong>of</strong> simulations are in<br />
better agreement with those <strong>of</strong> experiments for empty spheres than with <strong>PCM</strong><br />
spheres. The maximum temperature deviation between simulation <strong>and</strong> experimental<br />
results for empty spheres packing is less than 3K at steady state for the outlet liquid<br />
temperature. Compared with the empty spheres packing, the system <strong>of</strong> <strong>PCM</strong><br />
packing took longer time to reach steady sate due to the huge heat capacities <strong>of</strong><br />
<strong>PCM</strong>. However, this huge heat capacity should have an impact only during the<br />
transient period or startup <strong>of</strong> the plant. Therefore, the deviation between measured<br />
<strong>and</strong> simulated temperatures decreases when the system approaches steady state<br />
conditions.<br />
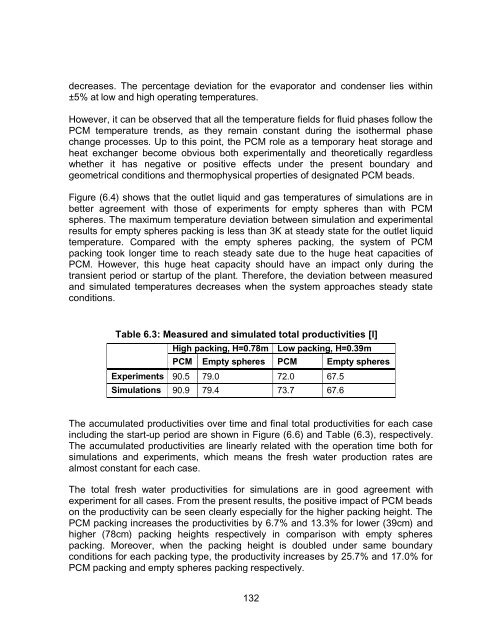
Table 6.3: Measured <strong>and</strong> simulated total productivities [l]<br />
High packing, H=0.78m Low packing, H=0.39m<br />
<strong>PCM</strong> Empty spheres <strong>PCM</strong> Empty spheres<br />
Experiments 90.5 79.0 72.0 67.5<br />
Simulations 90.9 79.4 73.7 67.6<br />
The accumulated productivities over time <strong>and</strong> final total productivities for each case<br />
including the start-up period are shown in Figure (6.6) <strong>and</strong> Table (6.3), respectively.<br />
The accumulated productivities are linearly related with the operation time both for<br />
simulations <strong>and</strong> experiments, which means the fresh water production rates are<br />
almost constant for each case.<br />
The total fresh water productivities for simulations are in good agreement with<br />
experiment for all cases. From the present results, the positive impact <strong>of</strong> <strong>PCM</strong> beads<br />
on the productivity can be seen clearly especially for the higher packing height. The<br />
<strong>PCM</strong> packing increases the productivities by 6.7% <strong>and</strong> 13.3% for lower (39cm) <strong>and</strong><br />
higher (78cm) packing heights respectively in comparison with empty spheres<br />
packing. Moreover, when the packing height is doubled under same boundary<br />
conditions for each packing type, the productivity increases by 25.7% <strong>and</strong> 17.0% for<br />
<strong>PCM</strong> packing <strong>and</strong> empty spheres packing respectively.<br />
132