Experimental and Numerical Analysis of a PCM-Supported ...
Experimental and Numerical Analysis of a PCM-Supported ...
Experimental and Numerical Analysis of a PCM-Supported ...

Create successful ePaper yourself
Turn your PDF publications into a flip-book with our unique Google optimized e-Paper software.
condensation load. Increasing the mass flow rate <strong>of</strong> cooling water perhaps could be<br />
the easiest way to provide such extra heat sink capacity. Nevertheless, the outlet<br />
cooling water temperature will decrease, which certainly would have a negative<br />
impact on the effectiveness <strong>of</strong> heat recovery down stream <strong>of</strong> the condenser as was<br />
described in figure (4.1).<br />
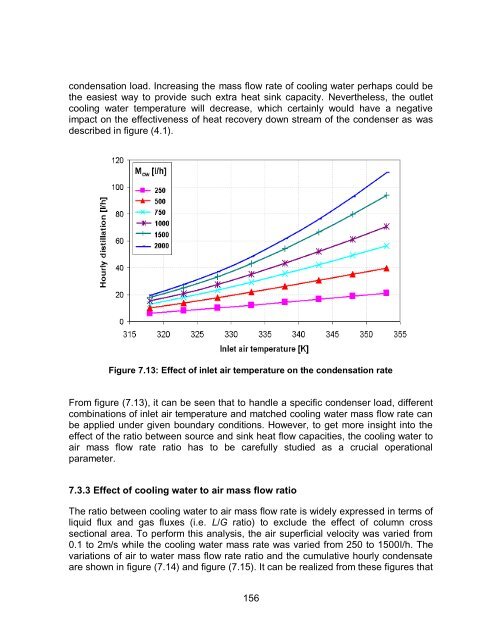
Figure 7.13: Effect <strong>of</strong> inlet air temperature on the condensation rate<br />
From figure (7.13), it can be seen that to h<strong>and</strong>le a specific condenser load, different<br />
combinations <strong>of</strong> inlet air temperature <strong>and</strong> matched cooling water mass flow rate can<br />
be applied under given boundary conditions. However, to get more insight into the<br />
effect <strong>of</strong> the ratio between source <strong>and</strong> sink heat flow capacities, the cooling water to<br />
air mass flow rate ratio has to be carefully studied as a crucial operational<br />
parameter.<br />
7.3.3 Effect <strong>of</strong> cooling water to air mass flow ratio<br />
The ratio between cooling water to air mass flow rate is widely expressed in terms <strong>of</strong><br />
liquid flux <strong>and</strong> gas fluxes (i.e. L/G ratio) to exclude the effect <strong>of</strong> column cross<br />
sectional area. To perform this analysis, the air superficial velocity was varied from<br />
0.1 to 2m/s while the cooling water mass rate was varied from 250 to 1500l/h. The<br />
variations <strong>of</strong> air to water mass flow rate ratio <strong>and</strong> the cumulative hourly condensate<br />
are shown in figure (7.14) <strong>and</strong> figure (7.15). It can be realized from these figures that<br />
156