- Page 1 and 2: KLEBER J. DENNY, INC. 312 Grandview
- Page 3 and 4: KLEBER J. DENNY, INC. 312 Grandview
- Page 5 and 6: FINAL REPORT ON TEXAS WATER DEVELOP
- Page 7 and 8: REPORT ON TASK NO. I: CO-LOCATION S
- Page 9 and 10: 1-2 1. GP/GT Fairways Information p
- Page 12 and 13: o s:: 011= m ,; .. f ; iI '& ri i'
- Page 14 and 15: Table S Selected Formation Water An
- Page 16 and 17: average depth of 10,033 feet, avera
- Page 18 and 19: high, the sands are not thick enoug
- Page 20 and 21: included distributary channel or de
- Page 22 and 23: the eastern part of the study area,
- Page 24 and 25: to coastal barrier sandstone on the
- Page 26 and 27: within Reservoir Area B, the sand a
- Page 28 and 29: Papadopulos, S. S., 1975, The Energ
- Page 32 and 33: only reason for selecting that limi
- Page 34 and 35: Hidalgo Co. , , , ,, , ,, , ,,, , ,
- Page 36 and 37: § 8 10,116' ;;;- - ... : 10,695' F
- Page 38 and 39: -r- ~~ '1- • r- ~~ .... . ~ 0 0 0
- Page 40 and 41: MARK SAND (MINIMUM) Geo2 Fluid Prod
- Page 42 and 43: BOND SAND (MINIMUM) Geo2 Fluid Prod
- Page 44 and 45: EAST SAND (MINIMUM) Geo2 Fluid Prod
- Page 46 and 47: MARK SAND (MINIMUM) Geo2 Fluid Prod
- Page 48 and 49: BOND SAND (MINIMUM) Geo2 Fluid Prod
- Page 50 and 51: EAST SAND (MAXIMUM) Geo2 Fluid Prod
- Page 52 and 53: MARK SAND (MINIMUM) 1 5 Year Cumula
- Page 54 and 55: BOND SAND (MINIMUM) 1 5 Year Cumula
- Page 56 and 57: EAST SAND (MINIMUM) 1 5 Year Cumula
- Page 58 and 59: jpH~j·:/·3,000 mgi1 TOS Sli,;,lly
- Page 60 and 61: average depth of 10,033 feet, avera
- Page 62 and 63: high, the sands are not thick enoug
- Page 64 and 65: included distributary channel or de
- Page 66 and 67: the eastern part of the study area,
- Page 68 and 69: to coastal barrier sandstone on the
- Page 70 and 71: Within Reservoir Area B, the sand a
- Page 72 and 73: Papadopulos, S. S., 1975, The Energ
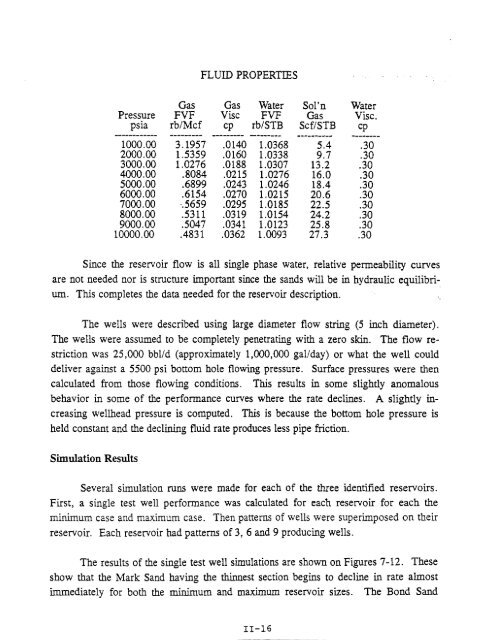
- Page 74 and 75: FLUID PROPERTIES Gas Gas Water Sol'
- Page 76 and 77: only reason for selecting that limi
- Page 78 and 79: Matrix of Locations!') and Descript
- Page 80 and 81:
• , l L , ,, , ,, , , ,, ,, , ,,
- Page 82 and 83:
"i 8 10,116' II =1 -- ~ ~ -- iii: 1
- Page 84 and 85:
-I- 0; 0 0 .f: 0 -. - . '-I- - . r-
- Page 86 and 87:
MARK SAND (MINIMUM) Geo2 Fluid Prod
- Page 88 and 89:
BOND SAND (MINIMUM) Geo2 Fluid Prod
- Page 90 and 91:
EAST SAND (MINIMUM) Geo2 Fluid Prod
- Page 92 and 93:
MARK SAND (MINIMUM) Geo2 Fluid Prod
- Page 94 and 95:
BOND SAND (MINIMUM) Geo2 Fluid Prod
- Page 96 and 97:
EAST SAND (MAXIMUM) Geo2 Fluid Prod
- Page 98 and 99:
MARK SAND (MINIMUM) 1 5 Year Cumula
- Page 100 and 101:
BOND SAND (MINIMUM) 1 5 Year Cumula
- Page 102 and 103:
.,,'" - •• 0. _. ___ _ EAST SAN
- Page 104 and 105:
STARR COUNTY I -i'J- ~ 10 b .......
- Page 106 and 107:
Net Sand Depth Thickness Sand Sand
- Page 108 and 109:
TABLE 5 TEXAS WATER DEVELOPMENT BOA
- Page 110 and 111:
ill-2 This process review is especi
- Page 112 and 113:
m-4 There are some built-in limitat
- Page 114 and 115:
ill-7 It is not surprising, therefo
- Page 116 and 117:
,,,,-,';8 .. - .. ~ Pretreatment Pr
- Page 118 and 119:
lli-9 Comparative Assumed Input Inr
- Page 120 and 121:
PRO-FORMA CALCULATIONS FOR REVERSE
- Page 122 and 123:
STEAM VENT EJECTOR • PRESSURE RED
- Page 124 and 125:
STEAM VENT EJECTOR I :> :>:> LfTl:>
- Page 126 and 127:
ID-16 a) The separate seawater inta
- Page 128 and 129:
1lI-18 Data for the injection flow
- Page 130 and 131:
lli-20 (8) Thermal content of fluid
- Page 132 and 133:
ill-22 The primary environmental co
- Page 134 and 135:
ill-24 III. B-2 BRINE DISPOSAL VIA
- Page 136 and 137:
1lI-26 to 10 centipoise if it is he
- Page 138 and 139:
1II-28 1lI.B-S&6 BYPRODUCT SALTS RE
- Page 140 and 141:
II I-3~ BRINES mOlAl( DlCAtlYDlAI!
- Page 142 and 143:
1II-32 2. Generally speaking, the s
- Page 144 and 145:
III-34 1. Group 1 through Group 4 w
- Page 146 and 147:
1II-36 Based on this comparative da
- Page 148 and 149:
In-38 Section UlD - Pro-Forma Econo
- Page 150 and 151:
II I -40 Exhibit InD-2 Assumed Inpu
- Page 152 and 153:
111-42 EXHIBIT llID-4 PRO-FORMA CAL
- Page 154 and 155:
Appendices
- Page 156 and 157:
Appendix A Preliminary Estimates of
- Page 158 and 159:
APPENDIX B
- Page 160 and 161:
-------- ThIs Underground Injection
- Page 162 and 163:
Federal Requirements - -"-J;' ... -
- Page 164 and 165:
Chapter II Summary of Injection Con
- Page 166 and 167:
.. ' a surface owner b. offset oper
- Page 168 and 169:
I. Special "Down Hole" Swvcys speci
- Page 170 and 171:
FLOWCHART: INJECTION/DISPOSAL WELL
- Page 172 and 173:
the applicant can show. by computat
- Page 174 and 175:
Criteria lor Determining the Adequa
- Page 176 and 177:
.I MODULAR POWER PLANTS FOR GEOPRES
- Page 178 and 179:
FIGURE 2 BINARY POWER MODULE··: .
- Page 180 and 181:
TABLE 1 GEOPRESSURED PLANT APPROXIM
- Page 182 and 183:
EGG-EP-8839 September 1991 Idaho Na
- Page 184 and 185:
EGG-EP-9839 Distribution Category:
- Page 186 and 187:
ACKNOWLEDGMENT Work supported by th
- Page 188 and 189:
APPENDIX A--SEATTLE TIMES EDITORIAL
- Page 190 and 191:
THE FEASIBILITY OF APPLYING GEOPRES
- Page 192 and 193:
University, January 10, 1990 with 6
- Page 194 and 195:
OF 35 50 100 150 200 250 300 I I I
- Page 196 and 197:
Desalination Plant Supply Well \ er
- Page 198 and 199:
for an extensive chicken hatching/r
- Page 200 and 201:
THE GEOPRESSURED RESOURCE Geopressu
- Page 202 and 203:
Production Co. has leased 4000 acre
- Page 204 and 205:
p' , ~"\ ,0 .~~ ~~ 'i ~ __ =:-~ 'l.
- Page 206 and 207:
Desalination Desalination is a prov
- Page 208 and 209:
--- r/< N N EIII ... IK:ltI' 011 ,,
- Page 210 and 211:
Sacramento Valley and San Joaquin V
- Page 212 and 213:
Gas Use and Sales Gas contained in
- Page 214 and 215:
Sulfur Fraschtng Sulfur can be reco
- Page 216 and 217:
Coal Desulfurization and Preparatio
- Page 218 and 219:
films. Today, nearly half of the br
- Page 220 and 221:
Waste gases Chlorinator Chlorine Di
- Page 222 and 223:
POTENTIAL AGRICULTURE/AQUACULTURE A
- Page 224 and 225:
The University of Southwestern loui
- Page 226 and 227:
Snapping turtles are important comp
- Page 228 and 229:
ECONOMIC CONSIDERATIONS This sectio
- Page 230 and 231:
economic techniques because cash fl
- Page 232 and 233:
Assuming a geopressured well can pr
- Page 234 and 235:
Table 3. Agriculture/aquaculture fi
- Page 236 and 237:
Circular Tank 90' Diam. 80'F Bypass
- Page 238 and 239:
Potable water for agriculture and a
- Page 240 and 241:
DESALINATION/AGRICULTURE/AQUACULTUR
- Page 242 and 243:
REFERENCES Carlson, R. A., P. H. Po
- Page 244 and 245:
APPENDIX A SEATTLE TIMES EDITORIAL
- Page 246 and 247:
APPENDIX B HEATING REQUIREMENTS FOR
- Page 248 and 249:
temperature and the heat gain curve
- Page 250 and 251:
Thermal Refuge Heating Requirements
- Page 252 and 253:
APPENDIX C INTEGRATED APPLICATIONS
- Page 254 and 255:
ANALYSIS OF WELL: Large Volume. Mod
- Page 256 and 257:
ANALYSIS OF WELL: large Volume, Mod
- Page 258 and 259:
ANALYSIS OF ~ELL: Large Volume. MOd
- Page 260 and 261:
APPENDIX D PRELIMINARY FEASIBILITY
- Page 262 and 263:
DES/ON • CONS(JI..TlNO • F',..,
- Page 264 and 265:
Des/oN • CONS
- Page 266 and 267:
Des/ON • CONS(.Jl..rINQ • F,A.S
- Page 268 and 269:
RED EWALD,lnc. 10,000 GALLON RACEWA
- Page 270 and 271:
",CUND F:;:SH C;LTURE TANKS ~.:::~
- Page 272 and 273:
~c:!~ ?:~:~.~ ?.I'n~ -: 1'DS-; mS-!
- Page 274 and 275:
* Texas A uaculture Association * A
- Page 276 and 277:
-----------------------------------
- Page 278 and 279:
RED EWALD. Ute. -- Round Fish Cultu
- Page 280 and 281:
PORTABLE MODULAR FISH HATCHERY SYST
- Page 282 and 283:
B & J Water- Well Ser-vice 419 East
- Page 284 and 285:
APPENDIX F COMPARATIVE PERFORMANCE
- Page 286 and 287:
BffiLIOGRAPHIC DATA SHEET for repor
- Page 288 and 289:
factors, utility costs, cash flow,
- Page 290 and 291:
afforded by low electridty rates al
- Page 292 and 293:
PRODUCTION LOSSES: With any type of
- Page 294 and 295:
deposits. minimum monthly customer
- Page 296 and 297:
conservative figure. This rate is u
- Page 298 and 299:
Other Capital Equipment YlETAL BUIL
- Page 300:
SECTION 3a. ~OTE 1 :-"-:ET CASH l1'
- Page 303 and 304:
TABLE 8·25. ASSl.;;-'1PT!O:\'S FOR
- Page 305 and 306:
TABLE B·26. GRED;HOUSE C.u>IT AL C
- Page 307 and 308:
.1 ~I ~ · ~ · ~ .. · · ~ ~ " -
- Page 309 and 310:
APPENDIX E
- Page 311 and 312:
Assumed Efficiency = 0.90 Constant
- Page 313 and 314:
EVALUATION OF AUTO DESALINATION As
- Page 315 and 316:
A review of the data for the wellhe
- Page 317 and 318:
J. McNutt & Associates, Inc. McAlle
- Page 319 and 320:
DownHole SAT(tm) SURFACE WATER DEPO
- Page 321 and 322:
DownHole SAT(tm) SURFACE WATER CHEM
- Page 323 and 324:
DownHole SAT(tm) SURFACE WATER MOME
- Page 325 and 326:
en C 0 09'8 -- += "0 c 0 U "0 X (])
- Page 327 and 328:
(/) c o += x -- (]) D -c 5 c u - D
- Page 329 and 330:
Degree of Supersaturation (E-01 ) 0
- Page 331 and 332:
(/) c - 0 (]) -- += > D (]) c -.J 0
- Page 333 and 334:
(/) c - 0 (]) 09'8 += -- > '"0 (])
- Page 335 and 336:
(/) c 0 - 09'8 -- :f= (]) -0 c > (]
- Page 337 and 338:
(/) c 0 09'8 -- =t= - C > 0 (]) U -
- Page 339 and 340:
C/) c 0 - 09'8 += (]) .- D c (]) >
- Page 341 and 342:
en - Cl) > Cl) C ..J o += C "'0 --
- Page 343 and 344:
APPENDIX G
- Page 345 and 346:
McPJlen Ranch, 7 t :> W:lter Recove
- Page 347 and 348:
c ~ (J) 09'8 0 (J) (]J 0 (1) U C2::
- Page 349 and 350:
McAJlen Ranch, 75'10 WJter Recovery
- Page 351 and 352:
IVlcPJlen I-
- Page 353 and 354:
c CJ) CJ) (]) ~ 0 U 0 X w & ~ ~ -m
- Page 355 and 356:
J) rJ) (1) u x W 09'8 ~o .. ..c. o
- Page 357 and 358:
c ~ 0 09'8 U) 0 U) (]) CJ.) ~ U ~ X
- Page 359 and 360:
McAJlen Ranch, 7510 W:1ter Recovery
- Page 361 and 362:
c ~ - 09'8 0 (]) 0 > Q) (]) -V ..J
- Page 363 and 364:
c ~ o
- Page 365 and 366:
c ~ 09"8 0 - (]) 0 > (]) (]) 0::: .
- Page 367 and 368:
c ~ 09'8 0 - 0 Cl) (1) > ~ Cl) ~ ..
- Page 369 and 370:
c ~ - 09'8 0 C]) 0 > (]) C]) v --1
- Page 371 and 372:
c ~ o (]) y - (l.) > (l.) ..J C o .
- Page 373 and 374:
00'8 ... .c U c -8 c (l) - ~ 5 - x
- Page 375 and 376:
c ~ X 0 Q.) u (}) -0 ""V - C ~ ~ c
- Page 377 and 378:
APPENDIX G 4 DEC 1993 TO: MR. KLEBE
- Page 379 and 380:
PRELIMINARY EDR/RO COSTS & PERFORMA
- Page 381 and 382:
GROUP 1 CONDITIONS 195,000 gpd bypa
- Page 383 and 384:
CASE 3 CONDITIONS 214,000 gpd bypas
- Page 385 and 386:
BUDGET CAPITAL COST REVIEW ---costs
- Page 387 and 388:
0H16D REVIEW OP O~11 COSTS .'.(1) -
- Page 389 and 390:
From: CANYON n,DUSTRIES, INC. 206 5