- Page 1 and 2:
European Observatory on Health Syst
- Page 3 and 4:
The European Observatory on Health
- Page 5 and 6:
Open University Press McGraw-Hill E
- Page 7 and 8:
European Observatory on Health Syst
- Page 9 and 10:
viii Contents five six The evidence
- Page 11 and 12:
List of tables 2.1 Beds in state ps
- Page 13 and 14:
List of figures 4.1 The production
- Page 15 and 16:
List of boxes 3.1 A personal testim
- Page 17 and 18:
List of contributors Francesco Amad
- Page 19 and 20:
xviii List of contributors Viviane
- Page 21 and 22:
Series editors’ introduction Euro
- Page 23 and 24:
Foreword Mental health may be the m
- Page 25 and 26:
Foreword by the Minister of Health
- Page 27 and 28:
Acknowledgements This volume is par
- Page 29 and 30:
chapter one Mental health policy an
- Page 31 and 32:
An overview 3 agencies (see Chapter
- Page 33 and 34:
An overview 5 Funding In broad term
- Page 35 and 36:
An overview 7 Social inclusion and
- Page 37 and 38:
An overview 9 actions such as inter
- Page 39 and 40:
An overview 11 of symptom alleviati
- Page 41 and 42:
An overview 13 Kessler, R.C., Demle
- Page 43 and 44:
chapter two The historical developm
- Page 45 and 46:
Historical development of mental he
- Page 47 and 48:
Historical development of mental he
- Page 49 and 50:
Historical development of mental he
- Page 51 and 52:
Historical development of mental he
- Page 53 and 54:
Historical development of mental he
- Page 55 and 56:
A lack of historical continuity His
- Page 57 and 58:
Historical development of mental he
- Page 59 and 60:
Historical development of mental he
- Page 61 and 62:
Historical development of mental he
- Page 63 and 64:
Tackling social exclusion 35 • in
- Page 65 and 66:
Tackling social exclusion 37 networ
- Page 67 and 68:
Tackling social exclusion 39 regula
- Page 69 and 70:
Tackling social exclusion 41 where
- Page 71 and 72:
Tackling social exclusion 43 and Sw
- Page 73 and 74:
Tackling social exclusion 45 addres
- Page 75 and 76:
Tackling social exclusion 47 than o
- Page 77 and 78:
Tackling social exclusion 49 in thi
- Page 79 and 80:
Tackling social exclusion 51 not ho
- Page 81 and 82:
Tackling social exclusion 53 Box 3.
- Page 83 and 84:
Tackling social exclusion 55 Conclu
- Page 85 and 86:
Tackling social exclusion 57 Disabi
- Page 87 and 88:
Tackling social exclusion 59 Read,
- Page 89 and 90:
Financing and funding 61 problems h
- Page 91 and 92:
Financing and funding 63 provides a
- Page 93 and 94:
Financing and funding 65 recognizin
- Page 95 and 96:
Financing and funding 67 care docto
- Page 97 and 98:
Financing and funding 69 Trends in
- Page 99 and 100:
Financing and funding 71 employment
- Page 101 and 102:
Financing and funding 73 kind, cove
- Page 103 and 104:
Financing and funding 75 emphasis o
- Page 105 and 106:
Financing and funding 77 provided i
- Page 107 and 108:
Financing and funding 79 for differ
- Page 109 and 110:
Financing and funding 81 budgets in
- Page 111 and 112:
Financing and funding 83 Europe or
- Page 113 and 114:
Financing and funding 85 the famili
- Page 115 and 116:
Financing and funding 87 of further
- Page 117 and 118:
Financing and funding 89 mental hea
- Page 119 and 120:
Financing and funding 91 community
- Page 121 and 122:
Financing and funding 93 Available
- Page 123 and 124:
Financing and funding 95 Basu, A. (
- Page 125 and 126:
Financing and funding 97 of interve
- Page 127 and 128: Financing and funding 99 World Heal
- Page 129 and 130: The evidence base 101 result of pub
- Page 131 and 132: The evidence base 103 campaigns, it
- Page 133 and 134: The evidence base 105 using health
- Page 135 and 136: Table 5.1 A matrix of evidence Rese
- Page 137 and 138: Identifying needs using epidemiolog
- Page 139 and 140: The evidence base 111 facilitate gl
- Page 141 and 142: The evidence base 113 Learning from
- Page 143 and 144: The evidence base 115 sources of ev
- Page 145 and 146: The evidence base 117 Europe, and i
- Page 147 and 148: The evidence base 119 to Policy pro
- Page 149 and 150: The evidence base 121 Finally, it i
- Page 151 and 152: The evidence base 123 Lavis, J., Ro
- Page 153 and 154: The evidence base 125 World Health
- Page 155 and 156: The treatment of mental disorders 1
- Page 157 and 158: The treatment of mental disorders 1
- Page 159 and 160: The treatment of mental disorders 1
- Page 161 and 162: The treatment of mental disorders 1
- Page 163 and 164: The treatment of mental disorders 1
- Page 165 and 166: The treatment of mental disorders 1
- Page 167 and 168: The treatment of mental disorders 1
- Page 169 and 170: The treatment of mental disorders 1
- Page 171 and 172: The treatment of mental disorders 1
- Page 173 and 174: The treatment of mental disorders 1
- Page 175 and 176: Psychopharmaceuticals in Europe 147
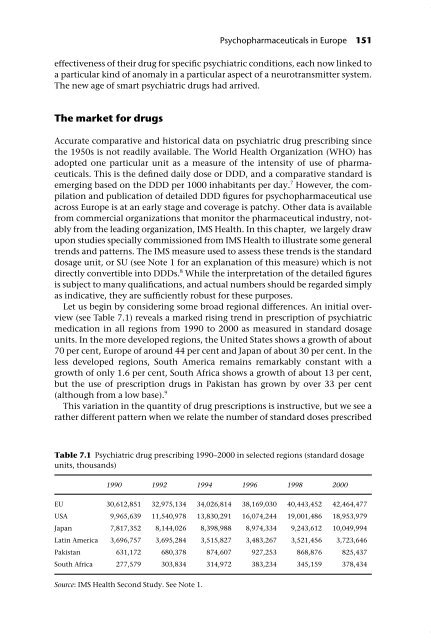
- Page 177: Psychopharmaceuticals in Europe 149
- Page 181 and 182: Psychopharmaceuticals in Europe 153
- Page 183 and 184: Table 7.6 Europe by drug type and c
- Page 185 and 186: Table 7.8 Europe by drug type and c
- Page 187 and 188: Table 7.10 Europe by drug type and
- Page 189 and 190: Table 7.12 Europe by drug type and
- Page 191 and 192: Table 7.14 Europe comparative presc
- Page 193 and 194: Psychopharmaceuticals in Europe 165
- Page 195 and 196: Table 7.20 Decline in psychiatric i
- Page 197 and 198: Psychopharmaceuticals in Europe 169
- Page 199 and 200: Psychopharmaceuticals in Europe 171
- Page 201 and 202: Psychopharmaceuticals in Europe 173
- Page 203 and 204: Psychopharmaceuticals in Europe 175
- Page 205 and 206: Psychopharmaceuticals in Europe 177
- Page 207 and 208: Psychopharmaceuticals in Europe 179
- Page 209 and 210: Psychopharmaceuticals in Europe 181
- Page 211 and 212: Psychopharmaceuticals in Europe 183
- Page 213 and 214: Psychopharmaceuticals in Europe 185
- Page 215 and 216: Psychopharmaceuticals in Europe 187
- Page 217 and 218: Promotion and prevention 189 Mental
- Page 219 and 220: Promotion and prevention 191 Box 8.
- Page 221 and 222: Promotion and prevention 193 risk o
- Page 223 and 224: Promotion and prevention 195 and th
- Page 225 and 226: Promotion and prevention 197 (Üstu
- Page 227 and 228: Promotion and prevention 199 and un
- Page 229 and 230:
Promotion and prevention 201 The li
- Page 231 and 232:
Promotion and prevention 203 income
- Page 233 and 234:
Promotion and prevention 205 implem
- Page 235 and 236:
Promotion and prevention 207 When d
- Page 237 and 238:
Promotion and prevention 209 health
- Page 239 and 240:
Promotion and prevention 211 Murphy
- Page 241 and 242:
Promotion and prevention 213 Vuori,
- Page 243 and 244:
chapter nine Common mental health p
- Page 245 and 246:
Mental health disorders in primary
- Page 247 and 248:
Mental health problems in primary c
- Page 249 and 250:
Mental health problems in primary c
- Page 251 and 252:
Mental health problems in primary c
- Page 253 and 254:
Mental health problems in primary c
- Page 255 and 256:
Mental health problems in primary c
- Page 257 and 258:
Mental health problems in primary c
- Page 259 and 260:
Mental health problems in primary c
- Page 261 and 262:
Mental health problems in primary c
- Page 263 and 264:
chapter ten Reforms in community ca
- Page 265 and 266:
Table 10.1 Mental health care in th
- Page 267 and 268:
Reforms in community care 239 syste
- Page 269 and 270:
Reforms in community care 241 integ
- Page 271 and 272:
Reforms in community care 243 In 19
- Page 273 and 274:
Reforms in community care 245 Secon
- Page 275 and 276:
Reforms in community care 247 must
- Page 277 and 278:
Reforms in community care 249 Goldb
- Page 279 and 280:
Addiction and alcohol 251 (Brown et
- Page 281 and 282:
Addiction and alcohol 253 Figure 11
- Page 283 and 284:
Addiction and alcohol 255 Table 11.
- Page 285 and 286:
Addiction and alcohol 257 Some stud
- Page 287 and 288:
Addiction and alcohol 259 availabil
- Page 289 and 290:
Addiction and alcohol 261 Table 11.
- Page 291 and 292:
Addiction and alcohol 263 Hours and
- Page 293 and 294:
Addiction and alcohol 265 College s
- Page 295 and 296:
Addiction and alcohol 267 Figure 11
- Page 297 and 298:
Addiction and alcohol 269 Figure 11
- Page 299 and 300:
Addiction and alcohol 271 Figure 11
- Page 301 and 302:
Addiction and alcohol 273 Alcohol t
- Page 303 and 304:
Addiction and alcohol 275 developme
- Page 305 and 306:
Addiction and alcohol 277 Greenfiel
- Page 307 and 308:
Addiction and alcohol 279 World Hea
- Page 309 and 310:
Housing and employment 281 European
- Page 311 and 312:
Housing and employment 283 to a lif
- Page 313 and 314:
Housing and employment 285 relative
- Page 315 and 316:
Housing and employment 287 comprise
- Page 317 and 318:
Housing and employment 289 treatmen
- Page 319 and 320:
Housing and employment 291 rented h
- Page 321 and 322:
Housing and employment 293 occupati
- Page 323 and 324:
Housing and employment 295 market;
- Page 325 and 326:
Housing and employment 297 Table 12
- Page 327 and 328:
Housing and employment 299 Return t
- Page 329 and 330:
Effectiveness of pre-vocational and
- Page 331 and 332:
Housing and employment 303 where re
- Page 333 and 334:
Housing and employment 305 mental h
- Page 335 and 336:
Housing and employment 307 S.M. (20
- Page 337 and 338:
A human rights perspective 309 Nor
- Page 339 and 340:
Monitoring compliance with the inte
- Page 341 and 342:
A human rights perspective 313 Ment
- Page 343 and 344:
A human rights perspective 315 Equa
- Page 345 and 346:
A human rights perspective 317 Last
- Page 347 and 348:
A human rights perspective 319 Comb
- Page 349 and 350:
A human rights perspective 321 segr
- Page 351 and 352:
A human rights perspective 323 The
- Page 353 and 354:
A human rights perspective 325 •
- Page 355 and 356:
A human rights perspective 327 ensu
- Page 357 and 358:
A human rights perspective 329 •
- Page 359 and 360:
A human rights perspective 331 Arti
- Page 361 and 362:
A human rights perspective 333 Refe
- Page 363 and 364:
A human rights perspective 335 Will
- Page 365 and 366:
The user and survivor movement 337
- Page 367 and 368:
The user and survivor movement 339
- Page 369 and 370:
The user and survivor movement 341
- Page 371 and 372:
The user and survivor movement 343
- Page 373 and 374:
The user and survivor movement 345
- Page 375 and 376:
The user and survivor movement 347
- Page 377 and 378:
The user and survivor movement 349
- Page 379 and 380:
The user and survivor movement 351
- Page 381 and 382:
The user and survivor movement 353
- Page 383 and 384:
The user and survivor movement 355
- Page 385 and 386:
Care of asylum seekers and refugees
- Page 387 and 388:
Care of asylum seekers and refugees
- Page 389 and 390:
Care of asylum seekers and refugees
- Page 391 and 392:
Care of asylum seekers and refugees
- Page 393 and 394:
Care of asylum seekers and refugees
- Page 395 and 396:
Care of asylum seekers and refugees
- Page 397 and 398:
generic local team or psychiatric h
- Page 399 and 400:
Care of asylum seekers and refugees
- Page 401 and 402:
Care of asylum seekers and refugees
- Page 403 and 404:
Carers and families 375 In this cha
- Page 405 and 406:
Carers and families 377 impact they
- Page 407 and 408:
Carers and families 379 2002). In a
- Page 409 and 410:
Carers and families 381 conducted i
- Page 411 and 412:
Carers and families 383 Interventio
- Page 413 and 414:
Carers and families 385 Child careg
- Page 415 and 416:
Carers and families 387 subject to
- Page 417 and 418:
Carers and families 389 Conclusion
- Page 419 and 420:
Carers and families 391 Cohen, C.A.
- Page 421 and 422:
Carers and families 393 in long-ter
- Page 423 and 424:
Carers and families 395 care in rel
- Page 425 and 426:
chapter seventeen Mental health pol
- Page 427 and 428:
Policy in former eastern bloc count
- Page 429 and 430:
Policy in former eastern bloc count
- Page 431 and 432:
Policy in former eastern bloc count
- Page 433 and 434:
Policy in former eastern bloc count
- Page 435 and 436:
Policy in former eastern bloc count
- Page 437 and 438:
Policy in former eastern bloc count
- Page 439 and 440:
Policy in former eastern bloc count
- Page 441 and 442:
Policy in former eastern bloc count
- Page 443 and 444:
Policy in former eastern bloc count
- Page 445 and 446:
Policy in former eastern bloc count
- Page 447 and 448:
Policy in former eastern bloc count
- Page 449 and 450:
Table 17.1 General information and
- Page 451 and 452:
Policy in former eastern bloc count
- Page 453 and 454:
Policy in former eastern bloc count
- Page 455 and 456:
Box 18.1 Recommendations in The Wor
- Page 457 and 458:
The WHO perspective 429 isolation,
- Page 459 and 460:
The WHO perspective 431 high when c
- Page 461 and 462:
The WHO perspective 433 Key issues
- Page 463 and 464:
The WHO perspective 435 Box 18.2 Qu
- Page 465 and 466:
The WHO perspective 437 services is
- Page 467 and 468:
The WHO perspective 439 Desjarlais,
- Page 469 and 470:
Index abuse of psychiatry, eastern
- Page 471 and 472:
Index 443 community care ECHR, 321
- Page 473 and 474:
Index 445 European countries commun
- Page 475 and 476:
Index 447 initiatives, discriminati
- Page 477 and 478:
Index 449 applying principles, 317-
- Page 479 and 480:
Index 451 policy, 228-9 practice, 2
- Page 481 and 482:
Related books from Open University
- Page 483:
PURCHASING TO IMPROVE HEALTH SYSTEM


