BaseStation 3200 User Manual â 11.7.5.15 ... - Baseline Systems
BaseStation 3200 User Manual â 11.7.5.15 ... - Baseline Systems
BaseStation 3200 User Manual â 11.7.5.15 ... - Baseline Systems

Create successful ePaper yourself
Turn your PDF publications into a flip-book with our unique Google optimized e-Paper software.
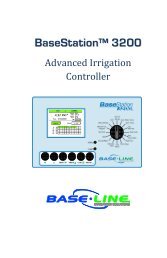
<strong>BaseStation</strong> <strong>3200</strong> Advanced Irrigation Controller <strong>Manual</strong><br />
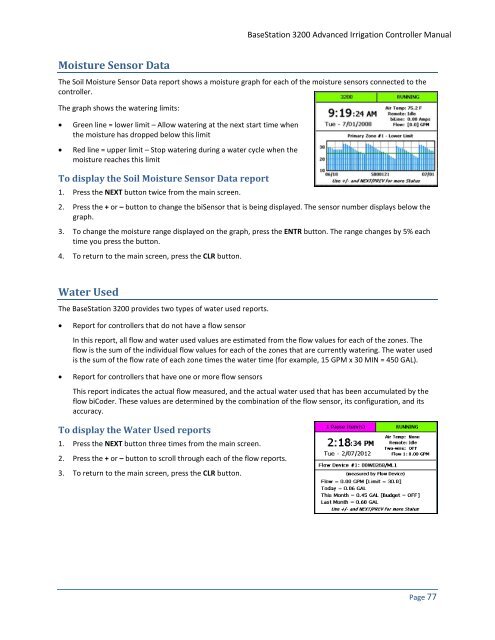
Moisture Sensor Data<br />
The Soil Moisture Sensor Data report shows a moisture graph for each of the moisture sensors connected to the<br />
controller.<br />
The graph shows the watering limits:<br />
• Green line = lower limit – Allow watering at the next start time when<br />
the moisture has dropped below this limit<br />
• Red line = upper limit – Stop watering during a water cycle when the<br />
moisture reaches this limit<br />
To display the Soil Moisture Sensor Data report<br />
1. Press the NEXT button twice from the main screen.<br />
2. Press the + or – button to change the biSensor that is being displayed. The sensor number displays below the<br />
graph.<br />
3. To change the moisture range displayed on the graph, press the ENTR button. The range changes by 5% each<br />
time you press the button.<br />
4. To return to the main screen, press the CLR button.<br />
Water Used<br />
The <strong>BaseStation</strong> <strong>3200</strong> provides two types of water used reports.<br />
• Report for controllers that do not have a flow sensor<br />
In this report, all flow and water used values are estimated from the flow values for each of the zones. The<br />
flow is the sum of the individual flow values for each of the zones that are currently watering. The water used<br />
is the sum of the flow rate of each zone times the water time (for example, 15 GPM x 30 MIN = 450 GAL).<br />
• Report for controllers that have one or more flow sensors<br />
This report indicates the actual flow measured, and the actual water used that has been accumulated by the<br />
flow biCoder. These values are determined by the combination of the flow sensor, its configuration, and its<br />
accuracy.<br />
To display the Water Used reports<br />
1. Press the NEXT button three times from the main screen.<br />
2. Press the + or – button to scroll through each of the flow reports.<br />
3. To return to the main screen, press the CLR button.<br />
Page 77