prepublication copy - The Department of Astronomy & Astrophysics ...
prepublication copy - The Department of Astronomy & Astrophysics ...
prepublication copy - The Department of Astronomy & Astrophysics ...

You also want an ePaper? Increase the reach of your titles
YUMPU automatically turns print PDFs into web optimized ePapers that Google loves.
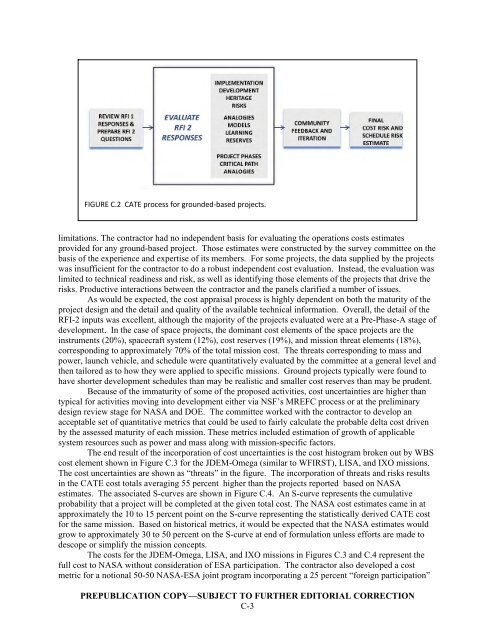
FIGURE C.2 CATE process for grounded‐based projects.<br />
limitations. <strong>The</strong> contractor had no independent basis for evaluating the operations costs estimates<br />
provided for any ground-based project. Those estimates were constructed by the survey committee on the<br />
basis <strong>of</strong> the experience and expertise <strong>of</strong> its members. For some projects, the data supplied by the projects<br />
was insufficient for the contractor to do a robust independent cost evaluation. Instead, the evaluation was<br />
limited to technical readiness and risk, as well as identifying those elements <strong>of</strong> the projects that drive the<br />
risks. Productive interactions between the contractor and the panels clarified a number <strong>of</strong> issues.<br />
As would be expected, the cost appraisal process is highly dependent on both the maturity <strong>of</strong> the<br />
project design and the detail and quality <strong>of</strong> the available technical information. Overall, the detail <strong>of</strong> the<br />
RFI-2 inputs was excellent, although the majority <strong>of</strong> the projects evaluated were at a Pre-Phase-A stage <strong>of</strong><br />
development. In the case <strong>of</strong> space projects, the dominant cost elements <strong>of</strong> the space projects are the<br />
instruments (20%), spacecraft system (12%), cost reserves (19%), and mission threat elements (18%),<br />
corresponding to approximately 70% <strong>of</strong> the total mission cost. <strong>The</strong> threats corresponding to mass and<br />
power, launch vehicle, and schedule were quantitatively evaluated by the committee at a general level and<br />
then tailored as to how they were applied to specific missions. Ground projects typically were found to<br />
have shorter development schedules than may be realistic and smaller cost reserves than may be prudent.<br />
Because <strong>of</strong> the immaturity <strong>of</strong> some <strong>of</strong> the proposed activities, cost uncertainties are higher than<br />
typical for activities moving into development either via NSF’s MREFC process or at the preliminary<br />
design review stage for NASA and DOE. <strong>The</strong> committee worked with the contractor to develop an<br />
acceptable set <strong>of</strong> quantitative metrics that could be used to fairly calculate the probable delta cost driven<br />
by the assessed maturity <strong>of</strong> each mission. <strong>The</strong>se metrics included estimation <strong>of</strong> growth <strong>of</strong> applicable<br />
system resources such as power and mass along with mission-specific factors.<br />
<strong>The</strong> end result <strong>of</strong> the incorporation <strong>of</strong> cost uncertainties is the cost histogram broken out by WBS<br />
cost element shown in Figure C.3 for the JDEM-Omega (similar to WFIRST), LISA, and IXO missions.<br />
<strong>The</strong> cost uncertainties are shown as “threats” in the figure. <strong>The</strong> incorporation <strong>of</strong> threats and risks results<br />
in the CATE cost totals averaging 55 percent higher than the projects reported based on NASA<br />
estimates. <strong>The</strong> associated S-curves are shown in Figure C.4. An S-curve represents the cumulative<br />
probability that a project will be completed at the given total cost. <strong>The</strong> NASA cost estimates came in at<br />
approximately the 10 to 15 percent point on the S-curve representing the statistically derived CATE cost<br />
for the same mission. Based on historical metrics, it would be expected that the NASA estimates would<br />
grow to approximately 30 to 50 percent on the S-curve at end <strong>of</strong> formulation unless efforts are made to<br />
descope or simplify the mission concepts.<br />
<strong>The</strong> costs for the JDEM-Omega, LISA, and IXO missions in Figures C.3 and C.4 represent the<br />
full cost to NASA without consideration <strong>of</strong> ESA participation. <strong>The</strong> contractor also developed a cost<br />
metric for a notional 50-50 NASA-ESA joint program incorporating a 25 percent “foreign participation”<br />
PREPUBLICATION COPY—SUBJECT TO FURTHER EDITORIAL CORRECTION<br />
C-3