- Page 1 and 2:
City of Oviedo Annual Budget FY 201
- Page 3 and 4:
CITY OF OVIEDO ANNUAL BUDGET FOR TH
- Page 5 and 6:
TABLE OF CONTENTS ANNUAL BUDGET Pag
- Page 7 and 8:
Project Summary and Operating Budge
- Page 9 and 10:
The City of Oviedo Florida ________
- Page 11 and 12:
The following “budget highlights
- Page 13 and 14:
Property Taxes (General Fund) At th
- Page 15 and 16:
Debt Service and Lease Financing Su
- Page 17 and 18:
Cash Reserves (Utility Operating Fu
- Page 19 and 20:
1 City of Oviedo The City of Oviedo
- Page 21 and 22:
City of Oviedo Organizational Chart
- Page 23 and 24:
City of Oviedo Strategic Focus Area
- Page 25 and 26:
City of Oviedo Continue to up
- Page 27 and 28:
City of Oviedo Budget and Financial
- Page 29 and 30:
City of Budget Document Format Ovie
- Page 31 and 32:
City of Oviedo certain fixed/sem i-
- Page 33 and 34:
City of Oviedo Budget Development G
- Page 35 and 36:
City of Oviedo afford the City the
- Page 37 and 38:
City of Oviedo Interlocal agreement
- Page 39 and 40:
City of Oviedo Significant Budget A
- Page 41 and 42:
City of Oviedo operating revenues a
- Page 43 and 44:
City of Oviedo Fund Categories and
- Page 45 and 46:
TABLE OF CONTENTS BUDGET GRAPHICS P
- Page 47 and 48:
PROPERTY TAX RATE AND TAXABLE VALUE
- Page 49 and 50:
Gross Taxable Value Tax Year 2011 a
- Page 51 and 52:
FY 2011-12 City of Oviedo Property
- Page 53 and 54:
TOTAL BUDGET SUMMARY AND GRAPHICS B
- Page 55 and 56:
BUDGET COMPARISON BY APPROPRIATED F
- Page 57 and 58:
CITY OF OVIEDO, FLORIDA BUDGET SUMM
- Page 59 and 60:
City of Oviedo FUND BALANCE OVERVIE
- Page 61 and 62:
FUND BALANCE STATUS BY FUND (Unaudi
- Page 63 and 64:
POSITION AUTHORIZATION SUMMARY Auth
- Page 65 and 66:
POSITION AUTHORIZATION SUMMARY FY 0
- Page 67 and 68:
Composition of Personnel Costs: FY
- Page 69 and 70:
GENERAL FUND GRAPHICS OVERVIEW FY 2
- Page 71 and 72:
GENERAL FUND EXPENDITURE SUMMARY FY
- Page 73 and 74:
City of Oviedo REVENUE TRENDS OVERV
- Page 75 and 76:
REVENUE TRENDS MAJOR REVENUE SOURCE
- Page 77 and 78:
Trend↓ REVENUE TRENDS MAJOR REVEN
- Page 79 and 80:
REVENUE TRENDS MAJOR REVENUE SOURCE
- Page 81 and 82:
TABLE OF CONTENTS REVENUE AND EXPEN
- Page 83 and 84:
GENERAL FUND The General Fund accou
- Page 85 and 86:
General Fund Revenues (001) Beginni
- Page 87 and 88:
General Fund Revenues (001) 2008-09
- Page 89 and 90:
General Fund Expenses (001) 2008-09
- Page 91 and 92:
General Fund Expenses (001) 2008-09
- Page 93 and 94:
SPECIAL REVENUE FUNDS Special Reven
- Page 95 and 96:
Administrative Facilities Impact Fe
- Page 97 and 98:
Police Impact Fee Fund (107) Beginn
- Page 99 and 100:
Recreational Impact Fee Fund (109)
- Page 101 and 102:
Federal Law Enforcement Trust Fund
- Page 103 and 104:
Transportation Improvements Fund (1
- Page 105 and 106:
Economic Development Fund (116) Beg
- Page 107 and 108:
Stormwater Fund (138) (Note: In FY
- Page 109 and 110:
DEBT SERVICE FUNDS Debt Service Fun
- Page 111 and 112:
Public Improvement Revenue Bonds De
- Page 113 and 114:
General Obligation Bond Debt Servic
- Page 115 and 116:
Lease Financing Fund (205) 2008-09
- Page 117 and 118:
CAPITAL PROJECT FUNDS Capital Proje
- Page 119 and 120:
Vehicle/Equipment Replacement Fund
- Page 121 and 122:
Local Option Sales Tax Construction
- Page 123 and 124:
Technology Improvements Fund (320)
- Page 125 and 126:
General Facilities Improvements Fun
- Page 127 and 128:
Public Works/Fire Station Construct
- Page 129 and 130:
Recreation Facilities Improvements
- Page 131 and 132:
ENTERPRISE FUNDS Enterprise Funds a
- Page 133 and 134:
Water/Wastewater Operating Fund (40
- Page 135 and 136:
Water/Wastewater Operating (401) Fu
- Page 137 and 138:
Reclaimed Water System Construction
- Page 139 and 140:
Utility Revenue Bond/SRF Loan Sinki
- Page 141 and 142:
Water/Wastewater Renewal and Replac
- Page 143 and 144:
Water System Impact Fee Fund (408)
- Page 145 and 146:
Series 2007 Utility Construction Fu
- Page 147 and 148:
Series 2010B Utility Revenue Bonds
- Page 149 and 150:
INTERNAL SERVICE FUNDS Account for
- Page 151 and 152:
Medical Insurance Fund (510) 2008-0
- Page 153 and 154:
City of Oviedo Legislative & Execut
- Page 155 and 156:
TABLE OF CONTENTS LEGISLATIVE AND E
- Page 157 and 158:
EXPENDITURE AND STAFFING SUMMARY De
- Page 159 and 160:
EXPENDITURE AND STAFFING SUMMARY De
- Page 161 and 162:
EXPENDITURE AND STAFFING SUMMARY De
- Page 163 and 164:
EXPENDITURE AND STAFFING SUMMARY De
- Page 165 and 166:
LEGISLATIVE AND EXECUTIVE SERVICES
- Page 167 and 168:
CONSOLIDATED EXPENDITURE DETAIL Dep
- Page 169 and 170:
City of Oviedo General Government S
- Page 171 and 172:
TABLE OF CONTENTS GENERAL GOVERNMEN
- Page 173 and 174:
Performance Profile (continued) Ris
- Page 175 and 176:
EXPENDITURE AND STAFFING SUMMARY De
- Page 177 and 178:
EXPENDITURE AND STAFFING SUMMARY De
- Page 179 and 180:
EXPENDITURE AND STAFFING SUMMARY De
- Page 181 and 182:
EXPENDITURE AND STAFFING SUMMARY De
- Page 183 and 184:
Department Finance Program Utility
- Page 185 and 186:
PERFORMANCE PROFILE Department Fina
- Page 187 and 188:
PERFORMANCE PROFILE Department Info
- Page 189 and 190:
Geographic Information Systems Meas
- Page 191 and 192:
GENERAL GOVERNMENT SERVICES CONSOLI
- Page 193 and 194:
CONSOLIDATED EXPENDITURE AND STAFFI
- Page 195 and 196:
CONSOLIDATED EXPENDITURE DETAIL Dep
- Page 197 and 198:
City of Oviedo Development Services
- Page 199 and 200:
TABLE OF CONTENTS DEVELOPMENT SERVI
- Page 201 and 202:
EXPENDITURE AND STAFFING SUMMARY De
- Page 203 and 204:
EXPENDITURE AND STAFFING SUMMARY De
- Page 205 and 206:
EXPENDITURE AND STAFFING SUMMARY De
- Page 207 and 208:
EXPENDITURE AND STAFFING SUMMARY De
- Page 209 and 210:
EXPENDITURE AND STAFFING SUMMARY De
- Page 211 and 212:
EXPENDITURE AND STAFFING SUMMARY De
- Page 213 and 214:
DEVELOPMENT SERVICES CONSOLIDATED E
- Page 215 and 216:
2008-09 2009-10 2010-11 2010-11 201
- Page 217 and 218:
City of Oviedo Law Enforcement 198
- Page 219 and 220:
TABLE OF CONTENTS POLICE Page Numbe
- Page 221 and 222:
EXPENDITURE AND STAFFING SUMMARY De
- Page 223 and 224:
EXPENDITURE AND STAFFING SUMMARY De
- Page 225 and 226:
EXPENDITURE AND STAFFING SUMMARY De
- Page 227 and 228:
School Resource Officers FY 08-09 F
- Page 229 and 230:
PERFORMANCE PROFILE Department Poli
- Page 231 and 232:
PERFORMANCE PROFILE Department Poli
- Page 233 and 234:
PERFORMANCE PROFILE Department Poli
- Page 235 and 236:
POLICE DEPARTMENT CONSOLIDATED EXPE
- Page 237 and 238:
2008-09 2009-10 2010-11 2010-11 201
- Page 239 and 240:
City of Oviedo Fire Rescue Services
- Page 241 and 242:
TABLE OF CONTENTS FIRE RESCUE Page
- Page 243 and 244:
EXPENDITURE AND STAFFING SUMMARY De
- Page 245 and 246: EXPENDITURE AND STAFFING SUMMARY De
- Page 247 and 248: EXPENDITURE AND STAFFING SUMMARY De
- Page 249 and 250: EXPENDITURE AND STAFFING SUMMARY De
- Page 251 and 252: FIRE DEPARTMENT CONSOLIDATED EXPEND
- Page 253 and 254: CONSOLIDATED EXPENDITURE DETAIL Dep
- Page 255 and 256: City of Oviedo Octoberfest Snow Mou
- Page 257 and 258: TABLE OF CONTENTS RECREATION & PARK
- Page 259 and 260: EXPENDITURE AND STAFFING SUMMARY De
- Page 261 and 262: PERFORMANCE PROFILE Department Recr
- Page 263 and 264: PERFORMANCE PROFILE Department Recr
- Page 265 and 266: PERFORMANCE PROFILE Department Recr
- Page 267 and 268: PERFORMANCE PROFILE Department Recr
- Page 269 and 270: EXPENDITURE AND STAFFING SUMMARY De
- Page 271 and 272: PERFORMANCE PROFILE Department Recr
- Page 273 and 274: PERFORMANCE PROFILE Department Recr
- Page 275 and 276: PERFORMANCE PROFILE Department Recr
- Page 277 and 278: PERFORMANCE PROFILE Department Recr
- Page 279 and 280: PERFORMANCE PROFILE Department Recr
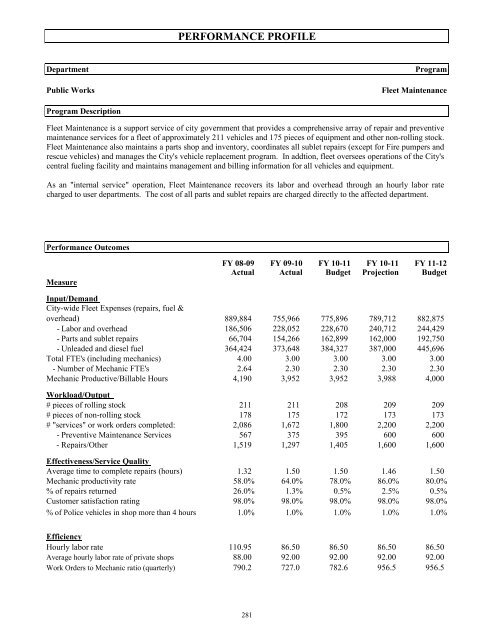
- Page 281 and 282: PERFORMANCE PROFILE Department Recr
- Page 283 and 284: RECREATION AND PARKS CONSOLIDATED E
- Page 285 and 286: 2008-09 2009-10 2010-11 2010-11 201
- Page 287 and 288: CONSOLIDATED EXPENDITURE DETAIL Dep
- Page 289 and 290: City of Oviedo Public Works Operati
- Page 291 and 292: TABLE OF CONTENTS PUBLIC WORKS Page
- Page 293 and 294: PERFORMANCE PROFILE Department Publ
- Page 295: PERFORMANCE PROFILE Department Publ
- Page 299 and 300: EXPENDITURE AND STAFFING SUMMARY De
- Page 301 and 302: PERFORMANCE PROFILE Department Publ
- Page 303 and 304: STORMWATER UTILITY Stormwater Engin
- Page 305 and 306: PERFORMANCE PROFILE Department Publ
- Page 307 and 308: PUBLIC WORKS* CONSOLIDATED EXPENDIT
- Page 309 and 310: 2008-09 2009-10 2010-11 2010-11 201
- Page 311 and 312: CONSOLIDATED EXPENDITURE DETAIL Dep
- Page 313 and 314: City of Oviedo Water / Wastewater U
- Page 315 and 316: TABLE OF CONTENTS WATER/WASTEWATER
- Page 317 and 318: EXPENDITURE AND STAFFING SUMMARY De
- Page 319 and 320: Department Finance Program Utility
- Page 321 and 322: The City of Oviedo 308
- Page 323 and 324: EXPENDITURE AND STAFFING SUMMARY De
- Page 325 and 326: EXPENDITURE AND STAFFING SUMMARY De
- Page 327 and 328: EXPENDITURE AND STAFFING SUMMARY De
- Page 329 and 330: EXPENDITURE AND STAFFING SUMMARY De
- Page 331 and 332: EXPENDITURE AND STAFFING SUMMARY De
- Page 333 and 334: EXPENDITURE AND STAFFING SUMMARY De
- Page 335 and 336: WATER AND WASTEWATER COMBINED EXPEN
- Page 337 and 338: 2008-09 2009-10 2010-11 2010-11 201
- Page 339 and 340: TABLE OF CONTENTS NON-DEPARTMENTAL
- Page 341 and 342: DEBT SERVICE OBLIGATIONS FY 07-08 F
- Page 343 and 344: DEBT SERVICE OBLIGATIONS FY 07-08 F
- Page 345 and 346: Revenue and GO Bond Debt Service Re
- Page 347 and 348:
Utility Debt Service Requirements t
- Page 349 and 350:
TABLE OF CONTENTS CAPITAL IMPROVEME
- Page 351 and 352:
City of ___ Oviedo Five Year Capita
- Page 353 and 354:
City of ___ Oviedo approximately 23
- Page 355 and 356:
5 YEAR CIP: EXPENDITURES BY PROJECT
- Page 357 and 358:
FY 11-12 FY 12-13 FY 13-14 FY 14-15
- Page 359 and 360:
FY 11-12 FY 12-13 FY 13-14 FY 14-15
- Page 361 and 362:
TABLE OF CONTENTS APPENDIX Page Num
- Page 363 and 364:
Glossary of Budget Terms ACTUAL Pre
- Page 365 and 366:
Oviedo Demographics: Fast Facts & S
- Page 367 and 368:
2010 Top Ten Taxpayers for Oviedo T
- Page 369 and 370:
The City of Oviedo