India: Effects of Tariffs and Nontariff Measures on U.S. ... - USITC
India: Effects of Tariffs and Nontariff Measures on U.S. ... - USITC
India: Effects of Tariffs and Nontariff Measures on U.S. ... - USITC
Create successful ePaper yourself
Turn your PDF publications into a flip-book with our unique Google optimized e-Paper software.
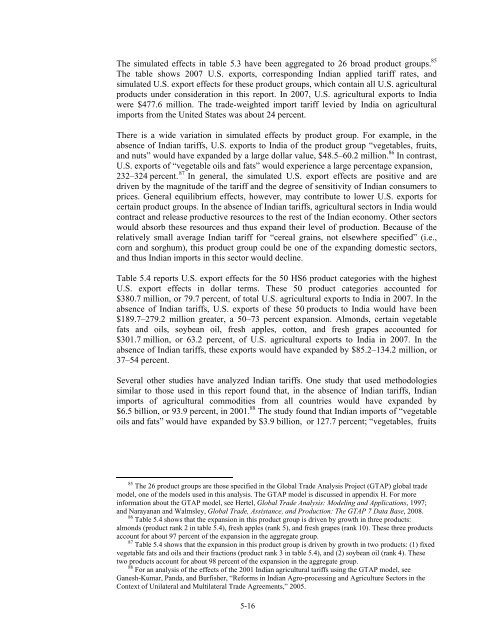
The simulated effects in table 5.3 have been aggregated to 26 broad product groups. 85<br />
The table shows 2007 U.S. exports, corresp<strong>on</strong>ding <str<strong>on</strong>g>India</str<strong>on</strong>g>n applied tariff rates, <str<strong>on</strong>g>and</str<strong>on</strong>g><br />
simulated U.S. export effects for these product groups, which c<strong>on</strong>tain all U.S. agricultural<br />
products under c<strong>on</strong>siderati<strong>on</strong> in this report. In 2007, U.S. agricultural exports to <str<strong>on</strong>g>India</str<strong>on</strong>g><br />
were $477.6 milli<strong>on</strong>. The trade-weighted import tariff levied by <str<strong>on</strong>g>India</str<strong>on</strong>g> <strong>on</strong> agricultural<br />
imports from the United States was about 24 percent.<br />
There is a wide variati<strong>on</strong> in simulated effects by product group. For example, in the<br />
absence <str<strong>on</strong>g>of</str<strong>on</strong>g> <str<strong>on</strong>g>India</str<strong>on</strong>g>n tariffs, U.S. exports to <str<strong>on</strong>g>India</str<strong>on</strong>g> <str<strong>on</strong>g>of</str<strong>on</strong>g> the product group “vegetables, fruits,<br />
<str<strong>on</strong>g>and</str<strong>on</strong>g> nuts” would have exp<str<strong>on</strong>g>and</str<strong>on</strong>g>ed by a large dollar value, $48.5–60.2 milli<strong>on</strong>. 86 In c<strong>on</strong>trast,<br />
U.S. exports <str<strong>on</strong>g>of</str<strong>on</strong>g> “vegetable oils <str<strong>on</strong>g>and</str<strong>on</strong>g> fats” would experience a large percentage expansi<strong>on</strong>,<br />
232–324 percent. 87 In general, the simulated U.S. export effects are positive <str<strong>on</strong>g>and</str<strong>on</strong>g> are<br />
driven by the magnitude <str<strong>on</strong>g>of</str<strong>on</strong>g> the tariff <str<strong>on</strong>g>and</str<strong>on</strong>g> the degree <str<strong>on</strong>g>of</str<strong>on</strong>g> sensitivity <str<strong>on</strong>g>of</str<strong>on</strong>g> <str<strong>on</strong>g>India</str<strong>on</strong>g>n c<strong>on</strong>sumers to<br />
prices. General equilibrium effects, however, may c<strong>on</strong>tribute to lower U.S. exports for<br />
certain product groups. In the absence <str<strong>on</strong>g>of</str<strong>on</strong>g> <str<strong>on</strong>g>India</str<strong>on</strong>g>n tariffs, agricultural sectors in <str<strong>on</strong>g>India</str<strong>on</strong>g> would<br />
c<strong>on</strong>tract <str<strong>on</strong>g>and</str<strong>on</strong>g> release productive resources to the rest <str<strong>on</strong>g>of</str<strong>on</strong>g> the <str<strong>on</strong>g>India</str<strong>on</strong>g>n ec<strong>on</strong>omy. Other sectors<br />
would absorb these resources <str<strong>on</strong>g>and</str<strong>on</strong>g> thus exp<str<strong>on</strong>g>and</str<strong>on</strong>g> their level <str<strong>on</strong>g>of</str<strong>on</strong>g> producti<strong>on</strong>. Because <str<strong>on</strong>g>of</str<strong>on</strong>g> the<br />
relatively small average <str<strong>on</strong>g>India</str<strong>on</strong>g>n tariff for “cereal grains, not elsewhere specified” (i.e.,<br />
corn <str<strong>on</strong>g>and</str<strong>on</strong>g> sorghum), this product group could be <strong>on</strong>e <str<strong>on</strong>g>of</str<strong>on</strong>g> the exp<str<strong>on</strong>g>and</str<strong>on</strong>g>ing domestic sectors,<br />
<str<strong>on</strong>g>and</str<strong>on</strong>g> thus <str<strong>on</strong>g>India</str<strong>on</strong>g>n imports in this sector would decline.<br />
Table 5.4 reports U.S. export effects for the 50 HS6 product categories with the highest<br />
U.S. export effects in dollar terms. These 50 product categories accounted for<br />
$380.7 milli<strong>on</strong>, or 79.7 percent, <str<strong>on</strong>g>of</str<strong>on</strong>g> total U.S. agricultural exports to <str<strong>on</strong>g>India</str<strong>on</strong>g> in 2007. In the<br />
absence <str<strong>on</strong>g>of</str<strong>on</strong>g> <str<strong>on</strong>g>India</str<strong>on</strong>g>n tariffs, U.S. exports <str<strong>on</strong>g>of</str<strong>on</strong>g> these 50 products to <str<strong>on</strong>g>India</str<strong>on</strong>g> would have been<br />
$189.7–279.2 milli<strong>on</strong> greater, a 50–73 percent expansi<strong>on</strong>. Alm<strong>on</strong>ds, certain vegetable<br />
fats <str<strong>on</strong>g>and</str<strong>on</strong>g> oils, soybean oil, fresh apples, cott<strong>on</strong>, <str<strong>on</strong>g>and</str<strong>on</strong>g> fresh grapes accounted for<br />
$301.7 milli<strong>on</strong>, or 63.2 percent, <str<strong>on</strong>g>of</str<strong>on</strong>g> U.S. agricultural exports to <str<strong>on</strong>g>India</str<strong>on</strong>g> in 2007. In the<br />
absence <str<strong>on</strong>g>of</str<strong>on</strong>g> <str<strong>on</strong>g>India</str<strong>on</strong>g>n tariffs, these exports would have exp<str<strong>on</strong>g>and</str<strong>on</strong>g>ed by $85.2–134.2 milli<strong>on</strong>, or<br />
37–54 percent.<br />
Several other studies have analyzed <str<strong>on</strong>g>India</str<strong>on</strong>g>n tariffs. One study that used methodologies<br />
similar to those used in this report found that, in the absence <str<strong>on</strong>g>of</str<strong>on</strong>g> <str<strong>on</strong>g>India</str<strong>on</strong>g>n tariffs, <str<strong>on</strong>g>India</str<strong>on</strong>g>n<br />
imports <str<strong>on</strong>g>of</str<strong>on</strong>g> agricultural commodities from all countries would have exp<str<strong>on</strong>g>and</str<strong>on</strong>g>ed by<br />
$6.5 billi<strong>on</strong>, or 93.9 percent, in 2001. 88 The study found that <str<strong>on</strong>g>India</str<strong>on</strong>g>n imports <str<strong>on</strong>g>of</str<strong>on</strong>g> “vegetable<br />
oils <str<strong>on</strong>g>and</str<strong>on</strong>g> fats” would have exp<str<strong>on</strong>g>and</str<strong>on</strong>g>ed by $3.9 billi<strong>on</strong>, or 127.7 percent; “vegetables, fruits<br />
85 The 26 product groups are those specified in the Global Trade Analysis Project (GTAP) global trade<br />
model, <strong>on</strong>e <str<strong>on</strong>g>of</str<strong>on</strong>g> the models used in this analysis. The GTAP model is discussed in appendix H. For more<br />
informati<strong>on</strong> about the GTAP model, see Hertel, Global Trade Analysis: Modeling <str<strong>on</strong>g>and</str<strong>on</strong>g> Applicati<strong>on</strong>s, 1997;<br />
<str<strong>on</strong>g>and</str<strong>on</strong>g> Narayanan <str<strong>on</strong>g>and</str<strong>on</strong>g> Walmsley, Global Trade, Assistance, <str<strong>on</strong>g>and</str<strong>on</strong>g> Producti<strong>on</strong>: The GTAP 7 Data Base, 2008.<br />
86 Table 5.4 shows that the expansi<strong>on</strong> in this product group is driven by growth in three products:<br />
alm<strong>on</strong>ds (product rank 2 in table 5.4), fresh apples (rank 5), <str<strong>on</strong>g>and</str<strong>on</strong>g> fresh grapes (rank 10). These three products<br />
account for about 97 percent <str<strong>on</strong>g>of</str<strong>on</strong>g> the expansi<strong>on</strong> in the aggregate group.<br />
87 Table 5.4 shows that the expansi<strong>on</strong> in this product group is driven by growth in two products: (1) fixed<br />
vegetable fats <str<strong>on</strong>g>and</str<strong>on</strong>g> oils <str<strong>on</strong>g>and</str<strong>on</strong>g> their fracti<strong>on</strong>s (product rank 3 in table 5.4), <str<strong>on</strong>g>and</str<strong>on</strong>g> (2) soybean oil (rank 4). These<br />
two products account for about 98 percent <str<strong>on</strong>g>of</str<strong>on</strong>g> the expansi<strong>on</strong> in the aggregate group.<br />
88 For an analysis <str<strong>on</strong>g>of</str<strong>on</strong>g> the effects <str<strong>on</strong>g>of</str<strong>on</strong>g> the 2001 <str<strong>on</strong>g>India</str<strong>on</strong>g>n agricultural tariffs using the GTAP model, see<br />
Ganesh-Kumar, P<str<strong>on</strong>g>and</str<strong>on</strong>g>a, <str<strong>on</strong>g>and</str<strong>on</strong>g> Burfisher, “Reforms in <str<strong>on</strong>g>India</str<strong>on</strong>g>n Agro-processing <str<strong>on</strong>g>and</str<strong>on</strong>g> Agriculture Sectors in the<br />
C<strong>on</strong>text <str<strong>on</strong>g>of</str<strong>on</strong>g> Unilateral <str<strong>on</strong>g>and</str<strong>on</strong>g> Multilateral Trade Agreements,” 2005.<br />
5-16


