

India: Effects of Tariffs and Nontariff Measures on U.S. ... - USITC
India: Effects of Tariffs and Nontariff Measures on U.S. ... - USITC
India: Effects of Tariffs and Nontariff Measures on U.S. ... - USITC

You also want an ePaper? Increase the reach of your titles
YUMPU automatically turns print PDFs into web optimized ePapers that Google loves.
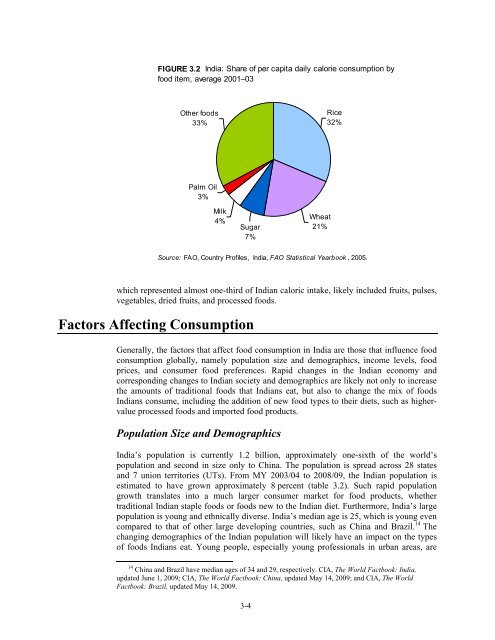
FIGURE 3.2 <str<strong>on</strong>g>India</str<strong>on</strong>g>: Share <str<strong>on</strong>g>of</str<strong>on</strong>g> per capita daily calorie c<strong>on</strong>sumpti<strong>on</strong> by<br />
food item, average 2001–03<br />
Other foods<br />
33%<br />
Rice<br />
32%<br />
Palm Oil<br />
3%<br />
Milk<br />
4%<br />
Sugar<br />
7%<br />
Wheat<br />
21%<br />
Source: FAO, Country Pr<str<strong>on</strong>g>of</str<strong>on</strong>g>iles, <str<strong>on</strong>g>India</str<strong>on</strong>g>, FAO Statistical Yearbook , 2005.<br />
which represented almost <strong>on</strong>e-third <str<strong>on</strong>g>of</str<strong>on</strong>g> <str<strong>on</strong>g>India</str<strong>on</strong>g>n caloric intake, likely included fruits, pulses,<br />
vegetables, dried fruits, <str<strong>on</strong>g>and</str<strong>on</strong>g> processed foods.<br />
Factors Affecting C<strong>on</strong>sumpti<strong>on</strong><br />
Generally, the factors that affect food c<strong>on</strong>sumpti<strong>on</strong> in <str<strong>on</strong>g>India</str<strong>on</strong>g> are those that influence food<br />
c<strong>on</strong>sumpti<strong>on</strong> globally, namely populati<strong>on</strong> size <str<strong>on</strong>g>and</str<strong>on</strong>g> demographics, income levels, food<br />
prices, <str<strong>on</strong>g>and</str<strong>on</strong>g> c<strong>on</strong>sumer food preferences. Rapid changes in the <str<strong>on</strong>g>India</str<strong>on</strong>g>n ec<strong>on</strong>omy <str<strong>on</strong>g>and</str<strong>on</strong>g><br />
corresp<strong>on</strong>ding changes to <str<strong>on</strong>g>India</str<strong>on</strong>g>n society <str<strong>on</strong>g>and</str<strong>on</strong>g> demographics are likely not <strong>on</strong>ly to increase<br />
the amounts <str<strong>on</strong>g>of</str<strong>on</strong>g> traditi<strong>on</strong>al foods that <str<strong>on</strong>g>India</str<strong>on</strong>g>ns eat, but also to change the mix <str<strong>on</strong>g>of</str<strong>on</strong>g> foods<br />
<str<strong>on</strong>g>India</str<strong>on</strong>g>ns c<strong>on</strong>sume, including the additi<strong>on</strong> <str<strong>on</strong>g>of</str<strong>on</strong>g> new food types to their diets, such as highervalue<br />
processed foods <str<strong>on</strong>g>and</str<strong>on</strong>g> imported food products.<br />
Populati<strong>on</strong> Size <str<strong>on</strong>g>and</str<strong>on</strong>g> Demographics<br />
<str<strong>on</strong>g>India</str<strong>on</strong>g>’s populati<strong>on</strong> is currently 1.2 billi<strong>on</strong>, approximately <strong>on</strong>e-sixth <str<strong>on</strong>g>of</str<strong>on</strong>g> the world’s<br />
populati<strong>on</strong> <str<strong>on</strong>g>and</str<strong>on</strong>g> sec<strong>on</strong>d in size <strong>on</strong>ly to China. The populati<strong>on</strong> is spread across 28 states<br />
<str<strong>on</strong>g>and</str<strong>on</strong>g> 7 uni<strong>on</strong> territories (UTs). From MY 2003/04 to 2008/09, the <str<strong>on</strong>g>India</str<strong>on</strong>g>n populati<strong>on</strong> is<br />
estimated to have grown approximately 8 percent (table 3.2). Such rapid populati<strong>on</strong><br />
growth translates into a much larger c<strong>on</strong>sumer market for food products, whether<br />
traditi<strong>on</strong>al <str<strong>on</strong>g>India</str<strong>on</strong>g>n staple foods or foods new to the <str<strong>on</strong>g>India</str<strong>on</strong>g>n diet. Furthermore, <str<strong>on</strong>g>India</str<strong>on</strong>g>’s large<br />
populati<strong>on</strong> is young <str<strong>on</strong>g>and</str<strong>on</strong>g> ethnically diverse. <str<strong>on</strong>g>India</str<strong>on</strong>g>’s median age is 25, which is young even<br />
compared to that <str<strong>on</strong>g>of</str<strong>on</strong>g> other large developing countries, such as China <str<strong>on</strong>g>and</str<strong>on</strong>g> Brazil. 14 The<br />
changing demographics <str<strong>on</strong>g>of</str<strong>on</strong>g> the <str<strong>on</strong>g>India</str<strong>on</strong>g>n populati<strong>on</strong> will likely have an impact <strong>on</strong> the types<br />
<str<strong>on</strong>g>of</str<strong>on</strong>g> foods <str<strong>on</strong>g>India</str<strong>on</strong>g>ns eat. Young people, especially young pr<str<strong>on</strong>g>of</str<strong>on</strong>g>essi<strong>on</strong>als in urban areas, are<br />
14 China <str<strong>on</strong>g>and</str<strong>on</strong>g> Brazil have median ages <str<strong>on</strong>g>of</str<strong>on</strong>g> 34 <str<strong>on</strong>g>and</str<strong>on</strong>g> 29, respectively. CIA, The World Factbook: <str<strong>on</strong>g>India</str<strong>on</strong>g>,<br />
updated June 1, 2009; CIA, The World Factbook: China, updated May 14, 2009; <str<strong>on</strong>g>and</str<strong>on</strong>g> CIA, The World<br />
Factbook: Brazil, updated May 14, 2009.<br />
3-4


