

India: Effects of Tariffs and Nontariff Measures on U.S. ... - USITC
India: Effects of Tariffs and Nontariff Measures on U.S. ... - USITC
India: Effects of Tariffs and Nontariff Measures on U.S. ... - USITC

You also want an ePaper? Increase the reach of your titles
YUMPU automatically turns print PDFs into web optimized ePapers that Google loves.
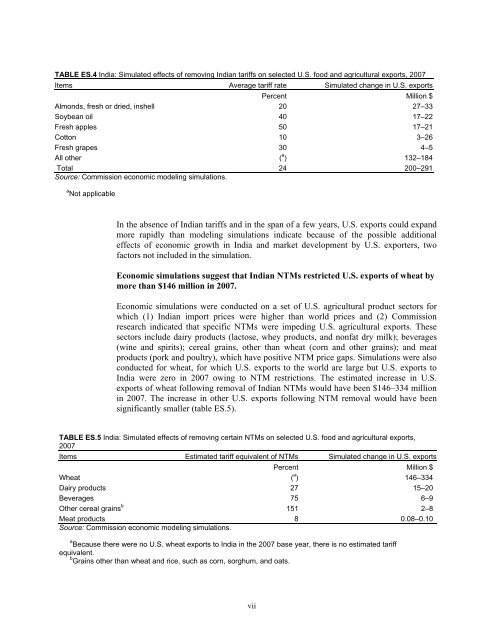
TABLE ES.4 <str<strong>on</strong>g>India</str<strong>on</strong>g>: Simulated effects <str<strong>on</strong>g>of</str<strong>on</strong>g> removing <str<strong>on</strong>g>India</str<strong>on</strong>g>n tariffs <strong>on</strong> selected U.S. food <str<strong>on</strong>g>and</str<strong>on</strong>g> agricultural exports, 2007<br />
Items Average tariff rate Simulated change in U.S. exports<br />
Percent Milli<strong>on</strong> $<br />
Alm<strong>on</strong>ds, fresh or dried, inshell 20 27–33<br />
Soybean oil 40 17–22<br />
Fresh apples 50 17–21<br />
Cott<strong>on</strong> 10 3–26<br />
Fresh grapes 30 4–5<br />
All other ( a ) 132–184<br />
Total 24 200–291<br />
Source: Commissi<strong>on</strong> ec<strong>on</strong>omic modeling simulati<strong>on</strong>s.<br />
a Not applicable<br />
In the absence <str<strong>on</strong>g>of</str<strong>on</strong>g> <str<strong>on</strong>g>India</str<strong>on</strong>g>n tariffs <str<strong>on</strong>g>and</str<strong>on</strong>g> in the span <str<strong>on</strong>g>of</str<strong>on</strong>g> a few years, U.S. exports could exp<str<strong>on</strong>g>and</str<strong>on</strong>g><br />
more rapidly than modeling simulati<strong>on</strong>s indicate because <str<strong>on</strong>g>of</str<strong>on</strong>g> the possible additi<strong>on</strong>al<br />
effects <str<strong>on</strong>g>of</str<strong>on</strong>g> ec<strong>on</strong>omic growth in <str<strong>on</strong>g>India</str<strong>on</strong>g> <str<strong>on</strong>g>and</str<strong>on</strong>g> market development by U.S. exporters, two<br />
factors not included in the simulati<strong>on</strong>.<br />
Ec<strong>on</strong>omic simulati<strong>on</strong>s suggest that <str<strong>on</strong>g>India</str<strong>on</strong>g>n NTMs restricted U.S. exports <str<strong>on</strong>g>of</str<strong>on</strong>g> wheat by<br />
more than $146 milli<strong>on</strong> in 2007.<br />
Ec<strong>on</strong>omic simulati<strong>on</strong>s were c<strong>on</strong>ducted <strong>on</strong> a set <str<strong>on</strong>g>of</str<strong>on</strong>g> U.S. agricultural product sectors for<br />
which (1) <str<strong>on</strong>g>India</str<strong>on</strong>g>n import prices were higher than world prices <str<strong>on</strong>g>and</str<strong>on</strong>g> (2) Commissi<strong>on</strong><br />
research indicated that specific NTMs were impeding U.S. agricultural exports. These<br />
sectors include dairy products (lactose, whey products, <str<strong>on</strong>g>and</str<strong>on</strong>g> n<strong>on</strong>fat dry milk); beverages<br />
(wine <str<strong>on</strong>g>and</str<strong>on</strong>g> spirits); cereal grains, other than wheat (corn <str<strong>on</strong>g>and</str<strong>on</strong>g> other grains); <str<strong>on</strong>g>and</str<strong>on</strong>g> meat<br />
products (pork <str<strong>on</strong>g>and</str<strong>on</strong>g> poultry), which have positive NTM price gaps. Simulati<strong>on</strong>s were also<br />
c<strong>on</strong>ducted for wheat, for which U.S. exports to the world are large but U.S. exports to<br />
<str<strong>on</strong>g>India</str<strong>on</strong>g> were zero in 2007 owing to NTM restricti<strong>on</strong>s. The estimated increase in U.S.<br />
exports <str<strong>on</strong>g>of</str<strong>on</strong>g> wheat following removal <str<strong>on</strong>g>of</str<strong>on</strong>g> <str<strong>on</strong>g>India</str<strong>on</strong>g>n NTMs would have been $146–334 milli<strong>on</strong><br />
in 2007. The increase in other U.S. exports following NTM removal would have been<br />
significantly smaller (table ES.5).<br />
TABLE ES.5 <str<strong>on</strong>g>India</str<strong>on</strong>g>: Simulated effects <str<strong>on</strong>g>of</str<strong>on</strong>g> removing certain NTMs <strong>on</strong> selected U.S. food <str<strong>on</strong>g>and</str<strong>on</strong>g> agricultural exports,<br />
2007<br />
Items Estimated tariff equivalent <str<strong>on</strong>g>of</str<strong>on</strong>g> NTMs Simulated change in U.S. exports<br />
Percent Milli<strong>on</strong> $<br />
Wheat ( a ) 146–334<br />
Dairy products 27 15–20<br />
Beverages 75 6–9<br />
Other cereal grains b 151 2–8<br />
Meat products 8 0.08–0.10<br />
Source: Commissi<strong>on</strong> ec<strong>on</strong>omic modeling simulati<strong>on</strong>s.<br />
a Because there were no U.S. wheat exports to <str<strong>on</strong>g>India</str<strong>on</strong>g> in the 2007 base year, there is no estimated tariff<br />
equivalent.<br />
b Grains other than wheat <str<strong>on</strong>g>and</str<strong>on</strong>g> rice, such as corn, sorghum, <str<strong>on</strong>g>and</str<strong>on</strong>g> oats.<br />
vii


